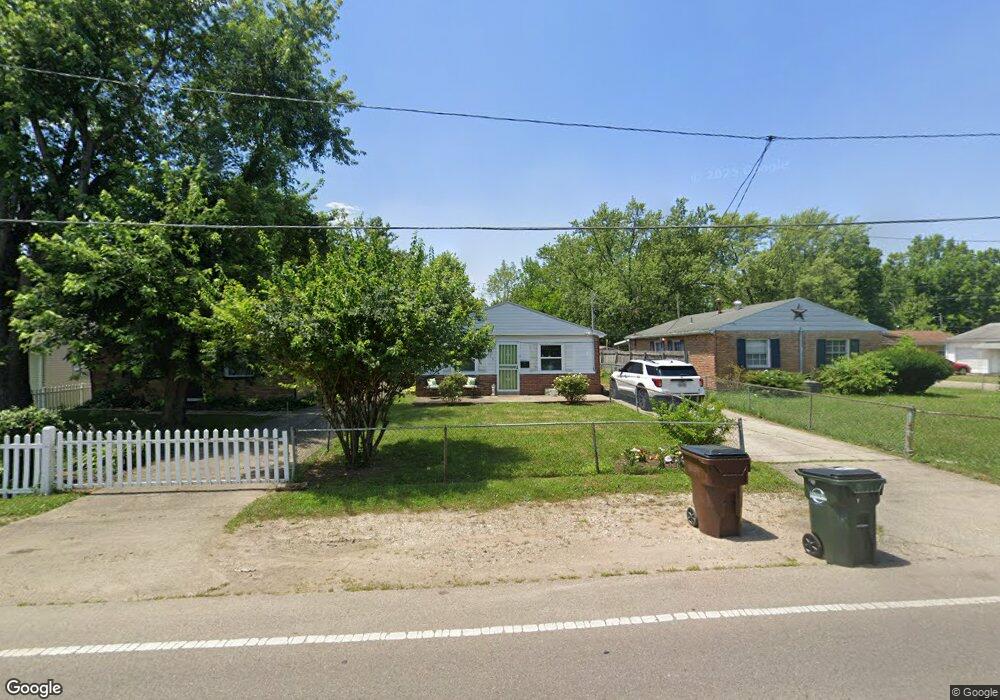
173 Olive Rd Dayton, OH 45417
Estimated Value: $66,000 - $109,000
3
Beds
1
Bath
975
Sq Ft
$81/Sq Ft
Est. Value
About This Home
This home is located at 173 Olive Rd, Dayton, OH 45417 and is currently estimated at $79,454, approximately $81 per square foot. 173 Olive Rd is a home located in Montgomery County with nearby schools including International School at Residence Park, Westwood Elementary, and Louise Troy Elementary.
Ownership History
Date
Name
Owned For
Owner Type
Purchase Details
Closed on
Aug 10, 2021
Sold by
Jrc Structures And Company Llc
Bought by
Giles Cailin
Current Estimated Value
Home Financials for this Owner
Home Financials are based on the most recent Mortgage that was taken out on this home.
Original Mortgage
$72,750
Outstanding Balance
$65,363
Interest Rate
2.7%
Mortgage Type
Purchase Money Mortgage
Estimated Equity
$14,091
Purchase Details
Closed on
Jan 27, 2021
Sold by
Paradise Art
Bought by
Jrc Structures And Company Llc
Purchase Details
Closed on
Jan 18, 2005
Sold by
The Jesus Combine Network Inc
Bought by
Paradise Arthur D
Purchase Details
Closed on
Aug 26, 2003
Sold by
Hud
Bought by
The Jesus Combine Network Inc
Purchase Details
Closed on
Apr 30, 2003
Sold by
Parker Glenna S
Bought by
Hud
Create a Home Valuation Report for This Property
The Home Valuation Report is an in-depth analysis detailing your home's value as well as a comparison with similar homes in the area
Purchase History
| Date | Buyer | Sale Price | Title Company |
|---|---|---|---|
| Giles Cailin | $80,000 | Chicago Title Company Llc | |
| Jrc Structures And Company Llc | $155,000 | Trico Title Inc | |
| Paradise Arthur D | -- | None Available | |
| The Jesus Combine Network Inc | $14,000 | Lakeside Title & Escrow Agen | |
| Hud | $30,000 | -- |
Source: Public Records
Mortgage History
| Date | Status | Borrower | Loan Amount |
|---|---|---|---|
| Open | Giles Cailin | $72,750 |
Source: Public Records
Tax History
| Year | Tax Paid | Tax Assessment Tax Assessment Total Assessment is a certain percentage of the fair market value that is determined by local assessors to be the total taxable value of land and additions on the property. | Land | Improvement |
|---|---|---|---|---|
| 2025 | $409 | $5,860 | $690 | $5,170 |
| 2024 | $400 | $5,860 | $690 | $5,170 |
| 2023 | $400 | $5,860 | $690 | $5,170 |
| 2022 | $481 | $5,550 | $650 | $4,900 |
| 2021 | $790 | $5,550 | $650 | $4,900 |
| 2020 | $653 | $5,550 | $650 | $4,900 |
| 2019 | $848 | $5,790 | $580 | $5,210 |
| 2018 | $847 | $5,790 | $580 | $5,210 |
| 2017 | $611 | $5,790 | $580 | $5,210 |
| 2016 | $575 | $5,860 | $650 | $5,210 |
| 2015 | $566 | $5,860 | $650 | $5,210 |
| 2014 | $566 | $5,860 | $650 | $5,210 |
| 2012 | -- | $7,920 | $2,840 | $5,080 |
Source: Public Records
Map
Nearby Homes
- 764 Miller Ave
- 0 Infirmary Rd Unit 953331
- 6290 Forestdale Ave
- 154 Pomeroy Ave
- 144 Pomeroy Ave
- 6925 W Third St
- 180 S Union Rd
- 12 Jenkins Dr
- 5216 W Third St
- 72 Patton Ave
- 137 Bluecrest Ave
- 1020 Park Glen Dr
- 5354 Gardendale Ave
- 5147 Whaley Dr
- 5157 Osceola Dr
- 786 Goodlow Ave
- 418 Mia Ave
- 734 Tyson Ave
- 4530 Chesapeake Ave
- 4519 Alfred Dr
Your Personal Tour Guide
Ask me questions while you tour the home.