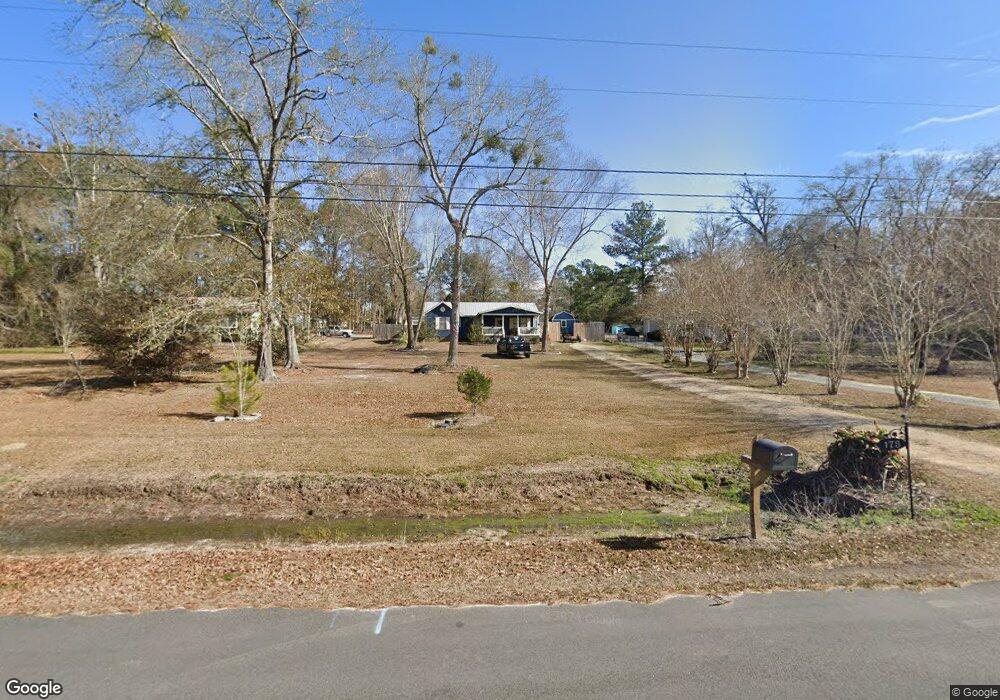
173 Point Rd Thomasville, GA 31757
Estimated Value: $187,702 - $250,000
3
Beds
1
Bath
1,198
Sq Ft
$178/Sq Ft
Est. Value
About This Home
This home is located at 173 Point Rd, Thomasville, GA 31757 and is currently estimated at $213,426, approximately $178 per square foot. 173 Point Rd is a home located in Thomas County with nearby schools including Hand in Hand Primary School, Cross Creek Elementary School, and Garrison-Pilcher Elementary School.
Ownership History
Date
Name
Owned For
Owner Type
Purchase Details
Closed on
Dec 7, 2015
Sold by
Roberts Paul L
Bought by
Green Cathy S
Current Estimated Value
Home Financials for this Owner
Home Financials are based on the most recent Mortgage that was taken out on this home.
Original Mortgage
$72,000
Interest Rate
3.91%
Mortgage Type
New Conventional
Purchase Details
Closed on
Dec 27, 2011
Sold by
Williford Heather
Bought by
Roberts Paul L
Purchase Details
Closed on
Jan 8, 2011
Sold by
Williford Joshua
Bought by
Williford Heather
Purchase Details
Closed on
Jan 8, 2010
Sold by
Williford Joshua T
Bought by
Williford Heather
Purchase Details
Closed on
Jul 5, 2005
Sold by
Grady Brian P
Bought by
Williford Joshua T and Williford Heather
Purchase Details
Closed on
Mar 23, 2000
Sold by
Shores Jeffrey M
Bought by
Grady Brian P
Purchase Details
Closed on
Jan 20, 1998
Bought by
Shores Jeffrey M
Create a Home Valuation Report for This Property
The Home Valuation Report is an in-depth analysis detailing your home's value as well as a comparison with similar homes in the area
Home Values in the Area
Average Home Value in this Area
Purchase History
| Date | Buyer | Sale Price | Title Company |
|---|---|---|---|
| Green Cathy S | $72,000 | -- | |
| Roberts Paul L | -- | -- | |
| Roberts Paul L | -- | -- | |
| Williford Heather | -- | -- | |
| Williford Heather | -- | -- | |
| Williford Joshua T | $82,000 | -- | |
| Grady Brian P | $65,900 | -- | |
| Shores Jeffrey M | $54,900 | -- |
Source: Public Records
Mortgage History
| Date | Status | Borrower | Loan Amount |
|---|---|---|---|
| Closed | Green Cathy S | $72,000 |
Source: Public Records
Tax History Compared to Growth
Tax History
| Year | Tax Paid | Tax Assessment Tax Assessment Total Assessment is a certain percentage of the fair market value that is determined by local assessors to be the total taxable value of land and additions on the property. | Land | Improvement |
|---|---|---|---|---|
| 2024 | $1,264 | $61,275 | $17,600 | $43,675 |
| 2023 | $1,140 | $56,583 | $16,000 | $40,583 |
| 2022 | $1,085 | $48,802 | $14,000 | $34,802 |
| 2021 | $1,054 | $43,038 | $14,000 | $29,038 |
| 2020 | $1,057 | $42,080 | $14,000 | $28,080 |
| 2019 | $1,068 | $42,080 | $14,000 | $28,080 |
| 2018 | $1,067 | $41,193 | $14,000 | $27,193 |
| 2017 | $941 | $35,777 | $12,460 | $23,317 |
| 2016 | $763 | $35,228 | $12,460 | $22,768 |
| 2015 | $917 | $34,060 | $11,620 | $22,440 |
| 2014 | $907 | $33,557 | $11,620 | $21,937 |
| 2013 | -- | $33,556 | $11,620 | $21,936 |
Source: Public Records
Map
Nearby Homes
- 106 Spiral Rd
- 250 Knoll Rd
- 00 Parcel # 053a313 West Shore Dr Lot 21
- 365 W Shore Dr
- 475 W Shore Dr
- 171 Longwood Dr
- 105 Mossy Creek Way
- 107 Mossy Creek Way
- 693 W Shore Dr
- 800 N Westshore Dr
- 800 Westshore Dr
- 475 Longwood Dr
- 8805 Georgia 202
- 10806 Georgia 202
- 900 Benton Rd
- 7216 Ga Highway 202
- 7216 Georgia 202
- 111 Willow Ridge Cir
- 210 Egg and Butter Rd N
- 210 Egg & Butter Rd
- 209 Point Rd
- 139 Point Rd
- 233 Point Rd
- 189 Spiral Rd
- 241 Point Rd
- 1106 Dixie Chastain Rd
- 210 Point Rd
- 101 Point Rd
- 186 Spiral Rd
- 168 Point Rd
- 171 Spiral Rd
- 234 Point Rd
- 1132 Dixie Chastain Rd
- 247 Point Rd
- 1150 Dixie Chastain Rd
- 63 Point Rd
- 149 Spiral Rd
- 168 Spiral Rd
- 153 Spiral Rd
- 0000 Point Road (1 27 Acres)