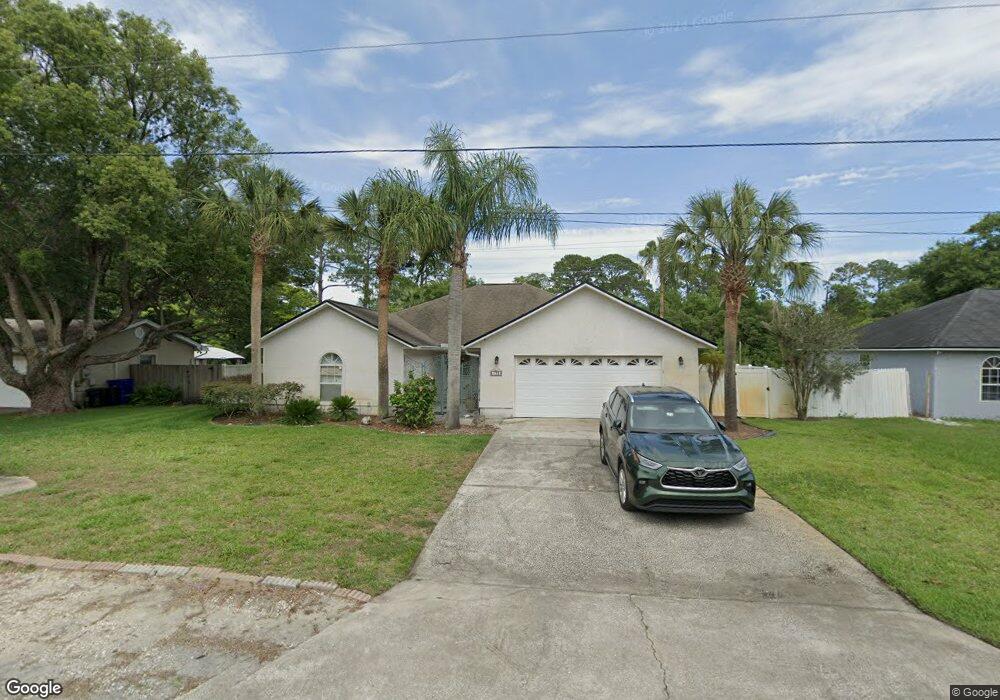
173 Segovia Rd Saint Augustine, FL 32086
Estimated Value: $387,000 - $485,700
3
Beds
2
Baths
1,929
Sq Ft
$222/Sq Ft
Est. Value
About This Home
This home is located at 173 Segovia Rd, Saint Augustine, FL 32086 and is currently estimated at $428,675, approximately $222 per square foot. 173 Segovia Rd is a home located in St. Johns County with nearby schools including Osceola Elementary School, R J Murray Middle School, and Pedro Menendez High School.
Ownership History
Date
Name
Owned For
Owner Type
Purchase Details
Closed on
Dec 11, 2014
Sold by
Payne Phillip and Payne Catherine
Bought by
Spisiak Sheila
Current Estimated Value
Purchase Details
Closed on
Apr 27, 2012
Sold by
Spisiak Shiela
Bought by
Payne Phillip and Payne Catherine
Home Financials for this Owner
Home Financials are based on the most recent Mortgage that was taken out on this home.
Original Mortgage
$229,000
Interest Rate
2%
Mortgage Type
Seller Take Back
Purchase Details
Closed on
Mar 8, 2005
Sold by
Diedrich Phillip S and Diedrich Susan S
Bought by
Spisiak Sheila
Purchase Details
Closed on
Aug 15, 2002
Sold by
Colson Stephen J and Colson Patricia A
Bought by
Diedrich Phillip S and Diedrich Susan S
Create a Home Valuation Report for This Property
The Home Valuation Report is an in-depth analysis detailing your home's value as well as a comparison with similar homes in the area
Home Values in the Area
Average Home Value in this Area
Purchase History
| Date | Buyer | Sale Price | Title Company |
|---|---|---|---|
| Spisiak Sheila | $210,000 | Attorney | |
| Payne Phillip | $229,000 | Attorney | |
| Spisiak Sheila | $299,000 | Independent Title | |
| Diedrich Phillip S | $160,000 | -- |
Source: Public Records
Mortgage History
| Date | Status | Borrower | Loan Amount |
|---|---|---|---|
| Previous Owner | Payne Phillip | $229,000 |
Source: Public Records
Tax History
| Year | Tax Paid | Tax Assessment Tax Assessment Total Assessment is a certain percentage of the fair market value that is determined by local assessors to be the total taxable value of land and additions on the property. | Land | Improvement |
|---|---|---|---|---|
| 2025 | $2,445 | $222,028 | -- | -- |
| 2024 | $2,445 | $215,771 | -- | -- |
| 2023 | $2,445 | $209,486 | $0 | $0 |
| 2022 | $2,366 | $203,384 | $0 | $0 |
| 2021 | $2,353 | $197,460 | $0 | $0 |
| 2020 | $2,330 | $193,748 | $0 | $0 |
| 2019 | $2,367 | $189,392 | $0 | $0 |
| 2018 | $2,335 | $185,861 | $0 | $0 |
| 2017 | $2,323 | $182,038 | $0 | $0 |
| 2016 | $2,320 | $183,643 | $0 | $0 |
| 2015 | $3,232 | $193,643 | $0 | $0 |
Source: Public Records
Map
Nearby Homes
- 2570 U S 1
- 129 Pelican Rd
- 124 Swallow Rd
- 212 Yale Rd
- 111 Lobelia Rd
- 5401 Shore Dr
- 155 Drake Rd
- 102 Alicante Rd
- 403 Segovia Rd
- 611 Queen Rd
- 6710 Route 1
- 108 Aspen Rd
- 1040 Prince Rd
- 132 Summerhill Cir
- 226 Jasmine Rd
- 215 Orchis Rd
- 110 Moultrie Village Ln
- 240 Jasmine Rd
- 116 Moultrie Crossing Ln
- 210 Dartmouth Rd
Your Personal Tour Guide
Ask me questions while you tour the home.