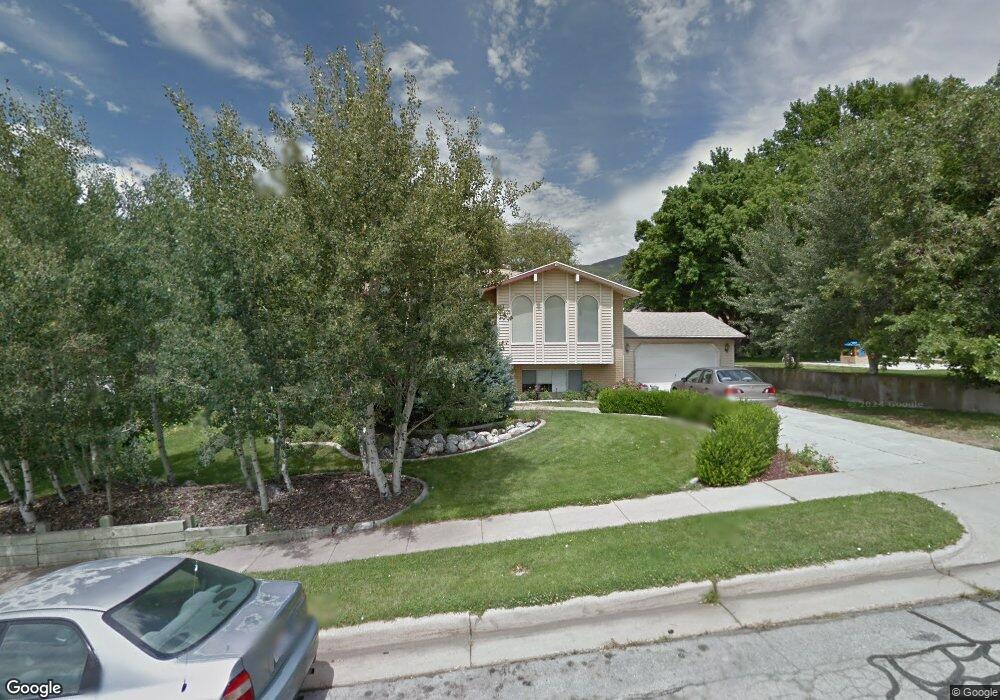
173 W 620 S Farmington, UT 84025
Estimated Value: $502,000 - $559,458
5
Beds
2
Baths
1,068
Sq Ft
$487/Sq Ft
Est. Value
About This Home
This home is located at 173 W 620 S, Farmington, UT 84025 and is currently estimated at $519,865, approximately $486 per square foot. 173 W 620 S is a home located in Davis County with nearby schools including Farmington Elementary School, Farmington High, and Farmington Junior High School.
Ownership History
Date
Name
Owned For
Owner Type
Purchase Details
Closed on
May 6, 2021
Sold by
Hills Kurt A and Hills Elaine O
Bought by
Swensen Jeff
Current Estimated Value
Purchase Details
Closed on
Feb 3, 2021
Sold by
Hills Kurt A and Hills Elaine O
Bought by
Hills Kurt A and Hills Elaine O
Purchase Details
Closed on
Jul 13, 2007
Sold by
Roper Matthew T S
Bought by
Hills Kurt A and Hills Elaine O
Home Financials for this Owner
Home Financials are based on the most recent Mortgage that was taken out on this home.
Original Mortgage
$232,000
Interest Rate
6.41%
Mortgage Type
New Conventional
Purchase Details
Closed on
Mar 21, 2002
Sold by
Roper Margaret F
Bought by
Roper Matthew T S
Home Financials for this Owner
Home Financials are based on the most recent Mortgage that was taken out on this home.
Original Mortgage
$105,000
Interest Rate
7.75%
Mortgage Type
Purchase Money Mortgage
Create a Home Valuation Report for This Property
The Home Valuation Report is an in-depth analysis detailing your home's value as well as a comparison with similar homes in the area
Home Values in the Area
Average Home Value in this Area
Purchase History
| Date | Buyer | Sale Price | Title Company |
|---|---|---|---|
| Swensen Jeff | -- | Premum Title & Esc | |
| Hills Kurt A | -- | None Available | |
| Hills Kurt A | -- | Western States Title Company | |
| Roper Matthew T S | -- | Wasatch Title Insurance Agen |
Source: Public Records
Mortgage History
| Date | Status | Borrower | Loan Amount |
|---|---|---|---|
| Previous Owner | Hills Kurt A | $232,000 | |
| Previous Owner | Roper Matthew T S | $105,000 |
Source: Public Records
Tax History Compared to Growth
Tax History
| Year | Tax Paid | Tax Assessment Tax Assessment Total Assessment is a certain percentage of the fair market value that is determined by local assessors to be the total taxable value of land and additions on the property. | Land | Improvement |
|---|---|---|---|---|
| 2024 | $2,707 | $270,599 | $136,276 | $134,323 |
| 2023 | $2,640 | $264,550 | $114,780 | $149,769 |
| 2022 | $2,626 | $494,000 | $187,851 | $306,149 |
| 2021 | $1,928 | $297,000 | $163,640 | $133,360 |
| 2020 | $1,751 | $263,000 | $140,294 | $122,706 |
| 2019 | $1,806 | $263,000 | $142,658 | $120,342 |
| 2018 | $1,700 | $244,000 | $138,299 | $105,701 |
| 2016 | $1,509 | $111,485 | $54,075 | $57,410 |
| 2015 | $1,442 | $101,090 | $54,075 | $47,015 |
| 2014 | $1,354 | $97,572 | $45,308 | $52,264 |
| 2013 | -- | $88,484 | $46,155 | $42,329 |
Source: Public Records
Map
Nearby Homes
- 247 Paulette Way
- 434 W 450 S Unit 815
- 1603 S 200 E
- 1597 S 200 E
- 250 S 200 W
- 800 S Rice Rd
- 903 S 200 E
- 431 E Greystone Dr
- 432 E Greystone Dr Unit 308
- 436 E Greystone Dr S Unit 309
- 467 Island View Cir
- 334 E Cottrell Ln
- 79 S 300 E
- 13 Sunset Dr
- 442 W Randys Ct Unit 808
- 21 N 100 W Unit 3
- 514 Rigby Rd
- 38 S 300 W
- 554 W Cottle Ln
- 372 W Clark Cir