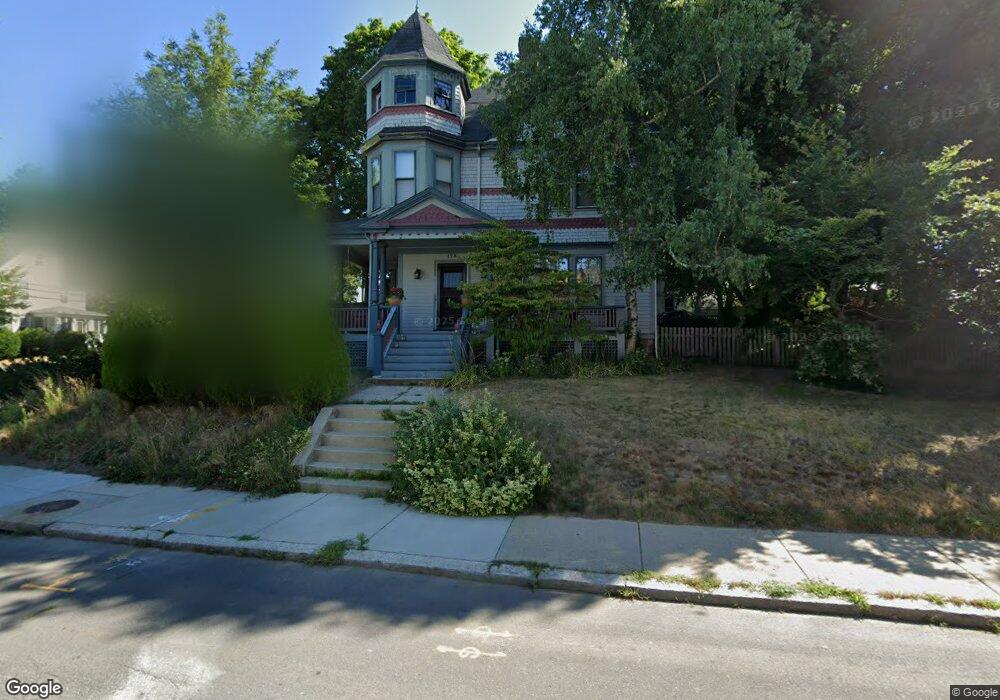
173 Willow St West Roxbury, MA 02132
West Roxbury NeighborhoodEstimated Value: $1,078,000 - $1,368,073
5
Beds
3
Baths
2,822
Sq Ft
$437/Sq Ft
Est. Value
About This Home
This home is located at 173 Willow St, West Roxbury, MA 02132 and is currently estimated at $1,233,268, approximately $437 per square foot. 173 Willow St is a home located in Suffolk County with nearby schools including Holy Name Parish School, St Theresa School, and The Roxbury Latin School.
Ownership History
Date
Name
Owned For
Owner Type
Purchase Details
Closed on
Nov 23, 2011
Sold by
Obrien Denis J and Fitzsimmons Kelly R
Bought by
Fitzsimmons Kelly R and Obrien Denis J
Current Estimated Value
Home Financials for this Owner
Home Financials are based on the most recent Mortgage that was taken out on this home.
Original Mortgage
$284,200
Outstanding Balance
$28,920
Interest Rate
4.12%
Mortgage Type
Purchase Money Mortgage
Estimated Equity
$1,204,348
Purchase Details
Closed on
Oct 27, 2000
Sold by
Shea M Susan
Bought by
Obrien Denis J and Fitzsimmons Kelly R
Create a Home Valuation Report for This Property
The Home Valuation Report is an in-depth analysis detailing your home's value as well as a comparison with similar homes in the area
Home Values in the Area
Average Home Value in this Area
Purchase History
| Date | Buyer | Sale Price | Title Company |
|---|---|---|---|
| Fitzsimmons Kelly R | -- | -- | |
| Obrien Denis J | $575,000 | -- |
Source: Public Records
Mortgage History
| Date | Status | Borrower | Loan Amount |
|---|---|---|---|
| Open | Fitzsimmons Kelly R | $284,200 | |
| Previous Owner | Obrien Denis J | $100,000 | |
| Previous Owner | Obrien Denis J | $50,000 | |
| Previous Owner | Obrien Denis J | $220,000 |
Source: Public Records
Tax History Compared to Growth
Tax History
| Year | Tax Paid | Tax Assessment Tax Assessment Total Assessment is a certain percentage of the fair market value that is determined by local assessors to be the total taxable value of land and additions on the property. | Land | Improvement |
|---|---|---|---|---|
| 2025 | $13,012 | $1,123,700 | $426,800 | $696,900 |
| 2024 | $12,427 | $1,140,100 | $414,900 | $725,200 |
| 2023 | $11,549 | $1,075,300 | $391,300 | $684,000 |
| 2022 | $10,635 | $977,500 | $355,700 | $621,800 |
| 2021 | $9,839 | $922,100 | $342,000 | $580,100 |
| 2020 | $9,226 | $873,700 | $286,300 | $587,400 |
| 2019 | $8,646 | $820,300 | $276,800 | $543,500 |
| 2018 | $8,268 | $788,900 | $276,800 | $512,100 |
| 2017 | $8,270 | $780,900 | $276,800 | $504,100 |
| 2016 | $8,028 | $729,800 | $276,800 | $453,000 |
| 2015 | $8,633 | $712,900 | $279,300 | $433,600 |
| 2014 | $8,461 | $672,600 | $279,300 | $393,300 |
Source: Public Records
Map
Nearby Homes
- 168 Maple St
- 19 Pomfret St
- 37 Pomfret St
- 55 Redlands Rd
- 1789 Centre St Unit 202
- 10 Burwell Rd
- 701 Vfw Pkwy
- 37 Hastings St Unit 103
- 76 Vermont St
- 110 Park St Unit 3
- 416 Belgrade Ave Unit 25
- 76 Potomac St
- 22 Bellevue St
- 79 Potomac St
- 539 Lagrange St
- 170 Payson Rd
- 150 Tyndale St Unit 2
- 311 Belgrade Ave
- 173 South St
- 9 Carroll St