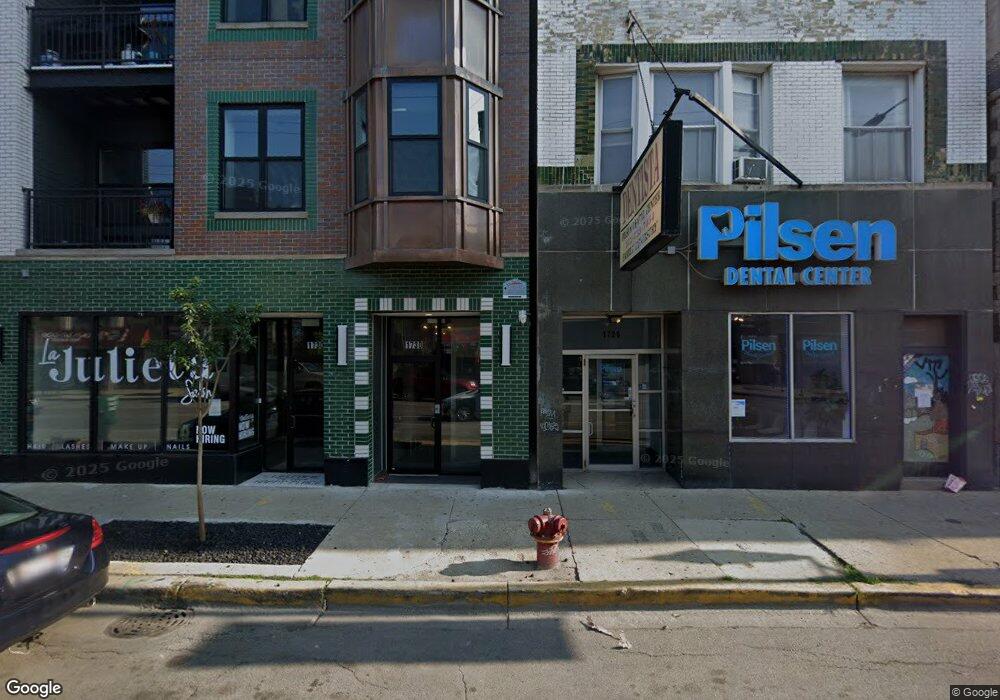
1730-34 W 18th Street - 1732- Store Front Chicago, IL 60608
Heart of Chicago NeighborhoodEstimated Value: $1,173,000
--
Bed
6
Baths
--
Sq Ft
3,006
Sq Ft Lot
About This Home
This home is located at 1730-34 W 18th Street - 1732- Store Front, Chicago, IL 60608 and is currently priced at $1,173,000. 1730-34 W 18th Street - 1732- Store Front is a home located in Cook County with nearby schools including Juarez Community Academy High School, Acero - Bartolomé de Las Casas Elementary School, and St. Pius V. School.
Ownership History
Date
Name
Owned For
Owner Type
Purchase Details
Closed on
Jun 12, 2016
Sold by
District 18 Two Llc
Bought by
Fox Chicago Llc
Current Estimated Value
Purchase Details
Closed on
Aug 20, 2014
Sold by
Rock Consulting Services
Bought by
District 18 Two Llc
Home Financials for this Owner
Home Financials are based on the most recent Mortgage that was taken out on this home.
Original Mortgage
$1,881,093
Interest Rate
4.1%
Mortgage Type
Future Advance Clause Open End Mortgage
Purchase Details
Closed on
Oct 22, 2013
Sold by
1730 To 1734 18Th Llc
Bought by
Rock Consulting Services
Home Financials for this Owner
Home Financials are based on the most recent Mortgage that was taken out on this home.
Original Mortgage
$300,000
Interest Rate
4.33%
Mortgage Type
Commercial
Purchase Details
Closed on
Feb 24, 2005
Sold by
Milutinovic Tommy
Bought by
1732 & 1734 18Th Llc
Create a Home Valuation Report for This Property
The Home Valuation Report is an in-depth analysis detailing your home's value as well as a comparison with similar homes in the area
Home Values in the Area
Average Home Value in this Area
Purchase History
| Date | Buyer | Sale Price | Title Company |
|---|---|---|---|
| Fox Chicago Llc | $950,000 | First American Title | |
| District 18 Two Llc | $575,000 | None Available | |
| Rock Consulting Services | $390,000 | Prism Title | |
| 1732 & 1734 18Th Llc | -- | -- |
Source: Public Records
Mortgage History
| Date | Status | Borrower | Loan Amount |
|---|---|---|---|
| Previous Owner | District 18 Two Llc | $1,881,093 | |
| Previous Owner | Rock Consulting Services | $300,000 |
Source: Public Records
Tax History Compared to Growth
Tax History
| Year | Tax Paid | Tax Assessment Tax Assessment Total Assessment is a certain percentage of the fair market value that is determined by local assessors to be the total taxable value of land and additions on the property. | Land | Improvement |
|---|---|---|---|---|
| 2024 | $13,401 | $60,860 | $12,000 | $48,860 |
| 2023 | $7,096 | $63,513 | $9,000 | $54,513 |
| 2022 | $7,096 | $34,500 | $9,000 | $25,500 |
| 2021 | $4,421 | $21,987 | $9,000 | $12,987 |
| 2020 | $5,974 | $26,817 | $7,050 | $19,767 |
| 2019 | $2,279 | $11,345 | $7,050 | $4,295 |
| 2018 | $2,674 | $13,537 | $7,050 | $6,487 |
| 2017 | $5,960 | $27,685 | $6,150 | $21,535 |
| 2016 | $5,545 | $27,685 | $6,150 | $21,535 |
| 2015 | $5,073 | $27,685 | $6,150 | $21,535 |
| 2014 | $4,083 | $22,007 | $5,400 | $16,607 |
| 2013 | $4,003 | $22,007 | $5,400 | $16,607 |
Source: Public Records
Map
Nearby Homes
- 1116 W 18th St
- 2029 W 17th St
- 1645 W 17th St
- 1727 W 19th St
- 1756 W Cullerton St Unit 3
- 2735 W 16th St
- 1817 S Ashland Ave
- 1823 W Cullerton St
- 1615 W 15th St
- 1521 W 17th St Unit 2
- 1538 W 21st St Unit 3A
- 1538 W 21st St Unit 1
- 1538 W 21st St Unit 2
- 1917 W 21st St
- 1635 W 21st Place Unit 1
- 1635 W 21st Place Unit 2
- 1635 W 21st Place Unit 3
- 1750 W Cermak Rd
- 1708 W Cermak Rd Unit 3W
- 2009 W Cullerton St
- 1736 W 18th St
- 1732 W 18th St
- 1734 W 18th St
- 1734 W 18th St Unit 3
- 1730 W 18th St Unit 1
- 1730 W 18th St Unit 401
- 1730 W 18th St Unit 301
- 1730 W 18th St
- 1730 W 18th St Unit 301
- 1730 W 18th St Unit 403
- 1730 W 18th St Unit 402
- 1730 W 18th St Unit 401
- 1730 W 18th St Unit 202
- 1730 W 18th St Unit 201
- 1730 W 18th St Unit 303
- 1730 W 18th St Unit 302
- 1730 W 18th St Unit 203
- 1730 W 18th St Unit 1-2-3
- 1738 W 18th St
- 1738 W 18th St Unit STORE