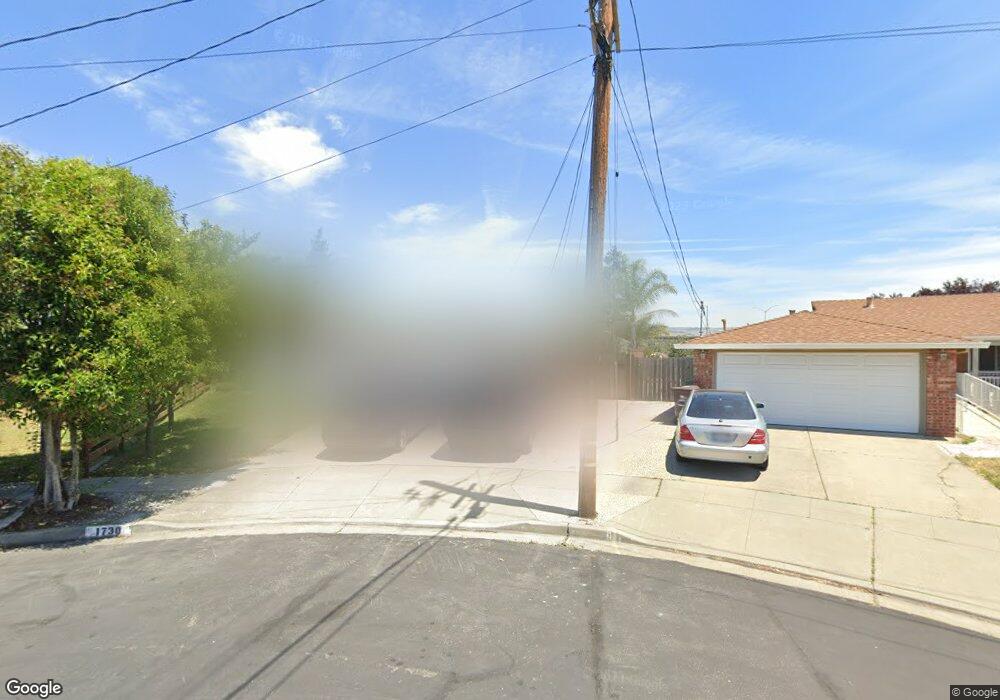
1730 Bobolink Ct Hayward, CA 94545
Glen Eden NeighborhoodEstimated Value: $858,000 - $1,015,312
3
Beds
2
Baths
1,224
Sq Ft
$754/Sq Ft
Est. Value
About This Home
This home is located at 1730 Bobolink Ct, Hayward, CA 94545 and is currently estimated at $923,078, approximately $754 per square foot. 1730 Bobolink Ct is a home located in Alameda County with nearby schools including Palma Ceia Elementary School, Anthony W. Ochoa Middle School, and Mt. Eden High School.
Ownership History
Date
Name
Owned For
Owner Type
Purchase Details
Closed on
Dec 28, 2006
Sold by
Alcazar Jose Luis Garcia and Garcia Rosalva A
Bought by
Alcazar Jose L and Garcia Rosalva A
Current Estimated Value
Home Financials for this Owner
Home Financials are based on the most recent Mortgage that was taken out on this home.
Original Mortgage
$285,000
Outstanding Balance
$169,841
Interest Rate
6.16%
Mortgage Type
Stand Alone Refi Refinance Of Original Loan
Estimated Equity
$753,237
Purchase Details
Closed on
Jun 24, 2005
Sold by
Garcia Jose L and Garcia Rosalva
Bought by
Alcazar Jose Luis Garcia and Garcia Rosalva A
Purchase Details
Closed on
Oct 25, 2001
Sold by
Garcia Rosa
Bought by
Garcia Jose
Home Financials for this Owner
Home Financials are based on the most recent Mortgage that was taken out on this home.
Original Mortgage
$290,062
Interest Rate
6.87%
Mortgage Type
Stand Alone First
Purchase Details
Closed on
Oct 22, 2001
Sold by
Liston Ronald Jay and Liston Doris Marie
Bought by
Garcia Jose
Home Financials for this Owner
Home Financials are based on the most recent Mortgage that was taken out on this home.
Original Mortgage
$290,062
Interest Rate
6.87%
Mortgage Type
Stand Alone First
Create a Home Valuation Report for This Property
The Home Valuation Report is an in-depth analysis detailing your home's value as well as a comparison with similar homes in the area
Home Values in the Area
Average Home Value in this Area
Purchase History
| Date | Buyer | Sale Price | Title Company |
|---|---|---|---|
| Alcazar Jose L | -- | Financial Title Company | |
| Alcazar Jose Luis Garcia | -- | Financial Title Company | |
| Alcazar Jose Luis Garcia | -- | -- | |
| Garcia Jose | -- | Fidelity National Title Co | |
| Garcia Jose | $331,500 | Fidelity National Title Co |
Source: Public Records
Mortgage History
| Date | Status | Borrower | Loan Amount |
|---|---|---|---|
| Open | Alcazar Jose L | $285,000 | |
| Previous Owner | Garcia Jose | $290,062 |
Source: Public Records
Tax History Compared to Growth
Tax History
| Year | Tax Paid | Tax Assessment Tax Assessment Total Assessment is a certain percentage of the fair market value that is determined by local assessors to be the total taxable value of land and additions on the property. | Land | Improvement |
|---|---|---|---|---|
| 2025 | $8,776 | $615,511 | $146,981 | $468,530 |
| 2024 | $8,776 | $603,443 | $144,099 | $459,344 |
| 2023 | $8,456 | $591,615 | $141,275 | $450,340 |
| 2022 | $7,511 | $580,014 | $138,504 | $441,510 |
| 2021 | $7,320 | $568,643 | $135,789 | $432,854 |
| 2020 | $5,954 | $464,828 | $134,397 | $330,431 |
| 2019 | $6,002 | $455,716 | $131,762 | $323,954 |
| 2018 | $5,441 | $430,382 | $129,179 | $301,203 |
| 2017 | $5,317 | $421,945 | $126,647 | $295,298 |
| 2016 | $5,012 | $413,675 | $124,165 | $289,510 |
| 2015 | $5,029 | $407,462 | $122,300 | $285,162 |
| 2014 | $4,668 | $399,483 | $119,905 | $279,578 |
Source: Public Records
Map
Nearby Homes
- 28845 La Corona St
- 28882 Miranda St
- 1541 Ortega Ave Unit 39
- 1587 de Lemos Ave
- 1439 Almeria Dr
- 28147 Murcia St Unit 324
- 1438 Salamanca Ave
- 1580 Balein Ct Unit 14
- 1925 Lilac Ave
- 1440 Buckingham Way
- 27923 Havana Ave
- 1352 Chelsea Way
- 29043 Windemere Rd
- 2187 Bourbon Dr
- 28290 Applegate St
- 27828 Mandarin Ave
- 2284 Bourbon Dr Unit 61
- 29046 Rochester Ct
- 2329 Bridwell Way
- 27781 Mandarin Ave
- 1738 Bobolink Ct
- 1741 Bobolink Ct
- 1746 Bobolink Ct
- 1747 Bobolink Ct
- 1729 Osage Ct
- 1755 Bobolink Ct
- 1754 Bobolink Ct
- 1737 Osage Ct
- 1748 Egret Ct
- 1763 Bobolink Ct
- 1745 Osage Ct
- 1762 Bobolink Ct
- 1740 Egret Ct
- 1713 Osage Ct
- 1753 Osage Ct
- 1756 Egret Ct
- 1771 Bobolink Ct
- 1770 Bobolink Ct
- 1761 Osage Ct
- 1764 Egret Ct