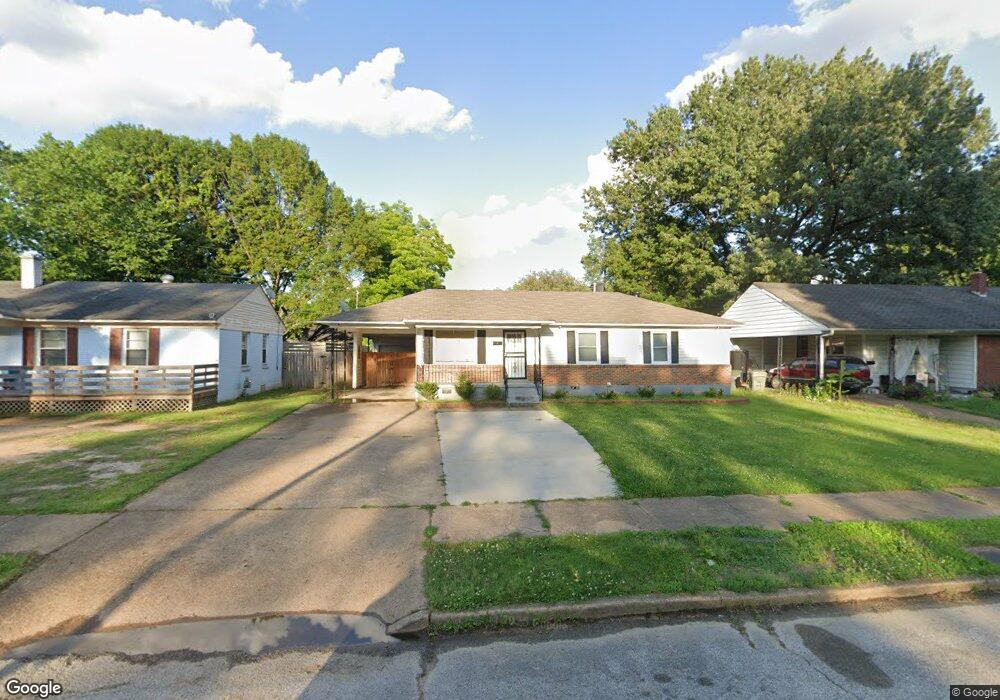
1730 Cornelia Ln Memphis, TN 38117
Colonial Acres NeighborhoodEstimated Value: $124,000 - $156,000
3
Beds
2
Baths
1,100
Sq Ft
$133/Sq Ft
Est. Value
About This Home
This home is located at 1730 Cornelia Ln, Memphis, TN 38117 and is currently estimated at $146,840, approximately $133 per square foot. 1730 Cornelia Ln is a home located in Shelby County with nearby schools including Willow Oaks Elementary School, Colonial Middle, and Overton High.
Ownership History
Date
Name
Owned For
Owner Type
Purchase Details
Closed on
Mar 27, 2019
Sold by
Rucker Anntionette
Bought by
Dodson Sonya L
Current Estimated Value
Purchase Details
Closed on
Jul 10, 2018
Sold by
Le Hung Q and Cao Thuy
Bought by
Dodson Sonya L and Rucker Anntionette
Purchase Details
Closed on
Apr 9, 2007
Sold by
Le Hung Q and Le Trach Thi
Bought by
Le Hung Q and Cao Thuy
Purchase Details
Closed on
Jun 27, 2003
Sold by
Nguyen Trinh Tuyet Thi
Bought by
Le Hung Q and Le Trach Thi
Home Financials for this Owner
Home Financials are based on the most recent Mortgage that was taken out on this home.
Original Mortgage
$69,451
Interest Rate
5.2%
Mortgage Type
FHA
Purchase Details
Closed on
Jun 20, 1997
Sold by
Flynn James Edward
Bought by
Nguyen Trinh Tuyet Thi
Home Financials for this Owner
Home Financials are based on the most recent Mortgage that was taken out on this home.
Original Mortgage
$58,000
Interest Rate
7.93%
Mortgage Type
Purchase Money Mortgage
Create a Home Valuation Report for This Property
The Home Valuation Report is an in-depth analysis detailing your home's value as well as a comparison with similar homes in the area
Home Values in the Area
Average Home Value in this Area
Purchase History
| Date | Buyer | Sale Price | Title Company |
|---|---|---|---|
| Dodson Sonya L | -- | None Available | |
| Dodson Sonya L | -- | None Available | |
| Le Hung Q | $39,000 | Cst Title Escrow Inc | |
| Le Hung Q | $70,000 | -- | |
| Nguyen Trinh Tuyet Thi | $72,500 | -- | |
| Nguyen Trinh Tuyet Thi | $72,500 | -- |
Source: Public Records
Mortgage History
| Date | Status | Borrower | Loan Amount |
|---|---|---|---|
| Previous Owner | Le Hung Q | $69,451 | |
| Previous Owner | Nguyen Trinh Tuyet Thi | $58,000 |
Source: Public Records
Tax History
| Year | Tax Paid | Tax Assessment Tax Assessment Total Assessment is a certain percentage of the fair market value that is determined by local assessors to be the total taxable value of land and additions on the property. | Land | Improvement |
|---|---|---|---|---|
| 2025 | $975 | $35,550 | $8,000 | $27,550 |
| 2024 | $975 | $28,775 | $4,425 | $24,350 |
| 2023 | $1,753 | $28,775 | $4,425 | $24,350 |
| 2022 | $1,753 | $28,775 | $4,425 | $24,350 |
| 2021 | $781 | $28,775 | $4,425 | $24,350 |
| 2020 | $1,473 | $20,325 | $4,425 | $15,900 |
| 2019 | $650 | $20,325 | $4,425 | $15,900 |
| 2018 | $650 | $20,325 | $4,425 | $15,900 |
| 2017 | $665 | $20,325 | $4,425 | $15,900 |
| 2016 | $798 | $18,250 | $0 | $0 |
| 2014 | $798 | $18,250 | $0 | $0 |
Source: Public Records
Map
Nearby Homes
- 1711 Myrna Ln
- 1782 Cornelia Ln
- 1776 Dorrie Ln
- 1771 Tahiti Ln
- 1750 Sea Isle Rd
- 1731 Sea Isle Rd
- 4584 E Dearing Rd
- 1597 Marcia Rd
- 1744 Dearing Rd
- 4487 E Dearing Rd
- 1869 Sea Isle Rd
- 1570 Dearing Rd
- 1886 Danville Rd
- 4457 Helene Rd
- 1903 Capri Rd
- 1646 Welsh Rd
- 4491 Dunn Ave
- 4436 Boyce Rd
- 4471 Jamaica Ave
- 1628 Cherry Rd
- 1724 Cornelia Ln
- 1736 Cornelia Ln
- 1729 S Perkins Rd
- 1716 Cornelia Ln
- 1744 Cornelia Ln
- 1723 S Perkins Rd
- 1735 S Perkins Rd
- 1729 Cornelia Ln
- 1717 S Perkins Rd
- 1735 Cornelia Ln
- 1743 S Perkins Rd
- 1723 Cornelia Ln
- 1750 Cornelia Ln
- 1710 Cornelia Ln
- 1715 Cornelia Ln
- 1743 Cornelia Ln
- 1711 S Perkins Rd
- 1749 S Perkins Rd
- 1749 Cornelia Ln
- 1709 Cornelia Ln
Your Personal Tour Guide
Ask me questions while you tour the home.