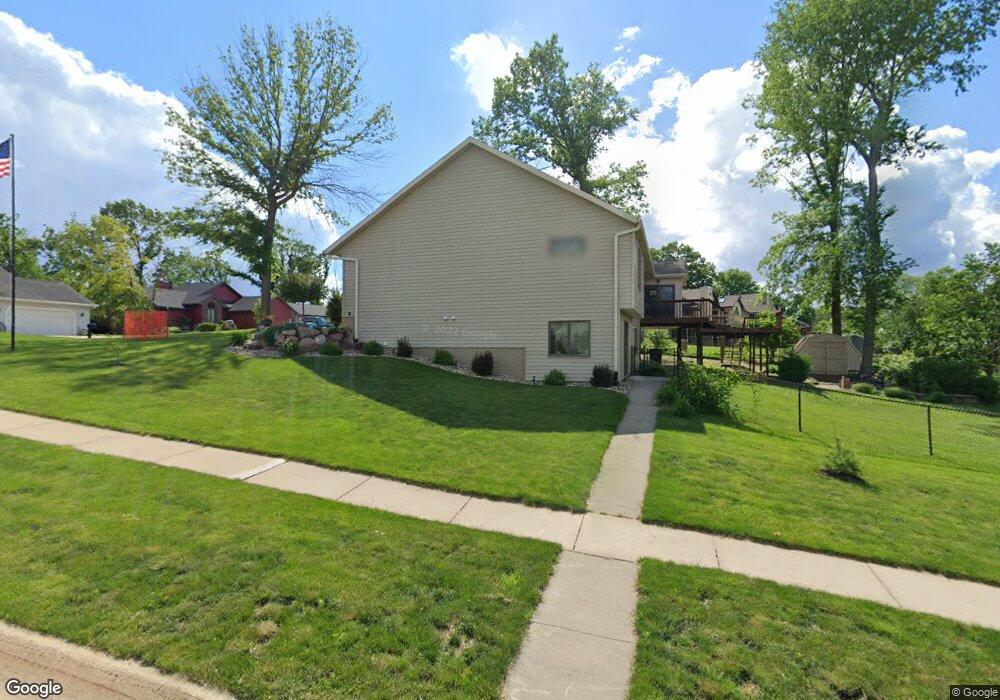
1730 Hidden Hollow Ln NW Cedar Rapids, IA 52405
Estimated Value: $311,000 - $346,000
4
Beds
3
Baths
2,367
Sq Ft
$139/Sq Ft
Est. Value
About This Home
This home is located at 1730 Hidden Hollow Ln NW, Cedar Rapids, IA 52405 and is currently estimated at $329,471, approximately $139 per square foot. 1730 Hidden Hollow Ln NW is a home located in Linn County with nearby schools including Harrison Elementary School, Kentucky Tech - Ashland Reg Tech Center, and Ponderosa Elementary School.
Ownership History
Date
Name
Owned For
Owner Type
Purchase Details
Closed on
Aug 21, 2009
Sold by
Baker Diane M and Baker John W
Bought by
Buikema Jon A
Current Estimated Value
Home Financials for this Owner
Home Financials are based on the most recent Mortgage that was taken out on this home.
Original Mortgage
$216,015
Outstanding Balance
$141,417
Interest Rate
5.29%
Mortgage Type
FHA
Estimated Equity
$188,054
Purchase Details
Closed on
Mar 5, 2004
Sold by
Sirva Relocation Llc
Bought by
Baker Diane M
Home Financials for this Owner
Home Financials are based on the most recent Mortgage that was taken out on this home.
Original Mortgage
$151,600
Interest Rate
3.87%
Mortgage Type
Unknown
Purchase Details
Closed on
Sep 4, 2003
Sold by
Bounds George E and Bounds Brenda J
Bought by
Sirva Relocation Llc
Create a Home Valuation Report for This Property
The Home Valuation Report is an in-depth analysis detailing your home's value as well as a comparison with similar homes in the area
Home Values in the Area
Average Home Value in this Area
Purchase History
| Date | Buyer | Sale Price | Title Company |
|---|---|---|---|
| Buikema Jon A | $219,500 | None Available | |
| Baker Diane M | $190,000 | -- | |
| Sirva Relocation Llc | $211,000 | -- |
Source: Public Records
Mortgage History
| Date | Status | Borrower | Loan Amount |
|---|---|---|---|
| Open | Buikema Jon A | $216,015 | |
| Previous Owner | Baker Diane M | $151,600 |
Source: Public Records
Tax History Compared to Growth
Tax History
| Year | Tax Paid | Tax Assessment Tax Assessment Total Assessment is a certain percentage of the fair market value that is determined by local assessors to be the total taxable value of land and additions on the property. | Land | Improvement |
|---|---|---|---|---|
| 2025 | $5,074 | $328,500 | $63,600 | $264,900 |
| 2024 | $5,258 | $313,800 | $59,400 | $254,400 |
| 2023 | $5,258 | $286,700 | $55,100 | $231,600 |
| 2022 | $5,200 | $249,300 | $48,800 | $200,500 |
| 2021 | $5,134 | $251,000 | $48,800 | $202,200 |
| 2020 | $5,134 | $232,700 | $48,800 | $183,900 |
| 2019 | $4,640 | $215,300 | $42,400 | $172,900 |
| 2018 | $4,512 | $215,300 | $42,400 | $172,900 |
| 2017 | $4,614 | $217,100 | $42,400 | $174,700 |
| 2016 | $4,614 | $217,100 | $42,400 | $174,700 |
| 2015 | $4,678 | $219,839 | $42,420 | $177,419 |
| 2014 | $4,678 | $230,276 | $42,420 | $187,856 |
| 2013 | $4,796 | $230,276 | $42,420 | $187,856 |
Source: Public Records
Map
Nearby Homes
- 1724 O Ave NW
- 1624 O Ave NW
- 0 O Ave NW
- 2048 20th St NW
- 2210 O Ave NW
- 1424 N Ave NW
- 2147 Sugar Creek Dr NW
- 2218 Tranquil Ct NW
- 2143 Sugar Creek Dr NW
- 2520 N Ave NW
- 1871 Ellis Blvd NW Unit 202
- 1871 Ellis Blvd NW Unit 205
- 2801 Schultz Dr NW
- 1130 13th St NW
- 1126 13th St NW
- 820 M Ave NW
- 2825 Schultz Dr NW
- 1733 Hillside Dr NW
- 1814 Shawnee Ct NW
- 1015 Pawnee Dr NW
- 1800 Hidden Hollow Ln NW
- 1816 Greentree Ct NW
- 1720 Hidden Hollow Ln NW
- 1811 Greentree Ct NW
- 1820 Hidden Hollow Ln NW
- 1729 Hidden Hollow Ln NW
- 1824 Greentree Ct NW
- 1725 Hidden Hollow Ln NW
- 1817 Greentree Ct NW
- 1861 Hidden Hollow Ct NW
- 1721 Hidden Hollow Ln NW
- 1838 Hidden Hollow Ln NW
- 1805 Hidden Hollow Ln NW
- 1714 Hidden Hollow Ln NW
- 1721 Whitters Way NW
- 1904 Greentree Ct NW
- 1717 Hidden Hollow Ln NW
- 1853 Hidden Hollow Ct NW
- 1815 Hidden Hollow Ln NW
- 1715 Whitters Way NW