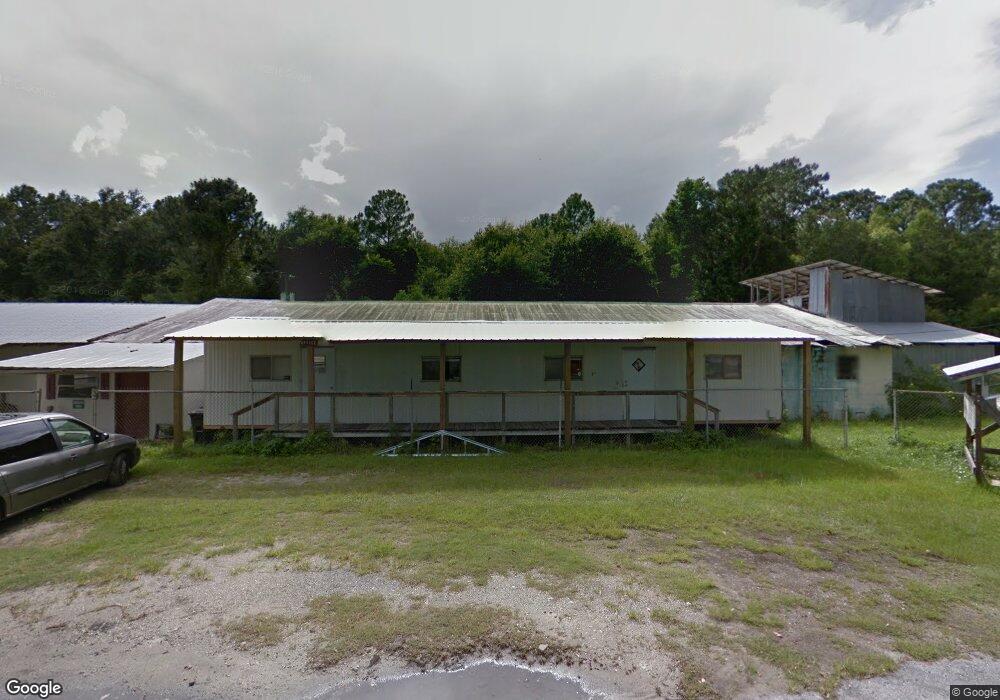
1730 NW Oakland Ave Lake City, FL 32055
Estimated Value: $135,707
--
Bed
--
Bath
8,598
Sq Ft
$16/Sq Ft
Est. Value
About This Home
This home is located at 1730 NW Oakland Ave, Lake City, FL 32055 and is currently estimated at $135,707, approximately $15 per square foot. 1730 NW Oakland Ave is a home located in Columbia County with nearby schools including Five Points Elementary School, Richardson Middle School, and Columbia High School.
Ownership History
Date
Name
Owned For
Owner Type
Purchase Details
Closed on
Sep 19, 2023
Sold by
Ruffo Jeffery
Bought by
Lake City Properties Vii Llc
Current Estimated Value
Purchase Details
Closed on
Feb 19, 2021
Sold by
Southern Specialty Builders Inc
Bought by
Drew Developments Llc
Purchase Details
Closed on
Dec 29, 2016
Sold by
Not Water Ventures Inc
Bought by
Southern Specialty Builders Inc
Purchase Details
Closed on
Dec 1, 2016
Bought by
Southern Specialty Builders In
Purchase Details
Closed on
Apr 3, 2012
Sold by
Southern Specialty Builders Inc
Bought by
Not Water Ventures Inc
Home Financials for this Owner
Home Financials are based on the most recent Mortgage that was taken out on this home.
Original Mortgage
$160,000
Interest Rate
4%
Mortgage Type
Seller Take Back
Create a Home Valuation Report for This Property
The Home Valuation Report is an in-depth analysis detailing your home's value as well as a comparison with similar homes in the area
Home Values in the Area
Average Home Value in this Area
Purchase History
| Date | Buyer | Sale Price | Title Company |
|---|---|---|---|
| Lake City Properties Vii Llc | $130,000 | Integrity Title Services | |
| Drew Developments Llc | $30,000 | Lake City Title | |
| Drew Developments Llc | $30,000 | Lake City Title | |
| Southern Specialty Builders Inc | $160,000 | Attorney | |
| Southern Specialty Builders In | $100 | -- | |
| Not Water Ventures Inc | $160,000 | Attorney |
Source: Public Records
Mortgage History
| Date | Status | Borrower | Loan Amount |
|---|---|---|---|
| Previous Owner | Not Water Ventures Inc | $160,000 |
Source: Public Records
Tax History Compared to Growth
Tax History
| Year | Tax Paid | Tax Assessment Tax Assessment Total Assessment is a certain percentage of the fair market value that is determined by local assessors to be the total taxable value of land and additions on the property. | Land | Improvement |
|---|---|---|---|---|
| 2024 | $1,352 | $74,365 | $30,223 | $44,142 |
| 2023 | $1,352 | $65,978 | $23,473 | $42,505 |
| 2022 | $1,241 | $57,906 | $23,473 | $34,433 |
| 2021 | $1,416 | $56,126 | $26,723 | $29,403 |
| 2020 | $1,424 | $55,347 | $26,723 | $28,624 |
| 2019 | $1,472 | $54,247 | $26,723 | $27,524 |
| 2018 | $1,459 | $52,629 | $25,473 | $27,156 |
| 2017 | $1,447 | $51,467 | $25,473 | $25,994 |
| 2016 | $1,993 | $50,947 | $25,473 | $25,474 |
Source: Public Records
Map
Nearby Homes
- 1668 N Us Highway 441
- 237 NE Gum Swamp Rd
- 181 NE Windall Ln
- 197 NE Windall Ln
- 253 NW Albritton Ln
- 243 NW Cheswick Dr
- 141 NE Fronie St
- TBD NW Bascom Norris Dr
- 208 NW Long St
- 0 NW Bascom Norris Dr Unit 129290
- 0 NW Bascom Norris Dr Unit 127435
- 283 NW Jefferson St
- 369 NE Diana Terrace
- 921 Dyson St
- 690 NW Alabama Terrace
- 507 NW Jamie Glen
- 214 NE Diana Terrace
- 143 NW Geranium Ct
- 138 NW Geranium Ct
- 1659 NW Cr-25a
- 428 NW County Road 25a
- 1775 NW Oakland Ave
- TBD SE Meeks St
- TBD Meeks St
- 1659 NW Oakland Ave
- 1651 NW Oakland Ave
- 316 NW Meeks St
- 1640 NW Oakland Ave
- 277 NW Jeb Terrace
- 171 NW Concrete Way
- 1620 NW Oakland Ave
- 1609 NW Oakland Ave
- 200 NW Nemo Terrace
- 337 NW Jeb Terrace
- 228 NW Nemo Terrace
- 246 NW Nemo Terrace
- 152 NW Jeb Terrace
- 1610 NW Oakland Ave
- 261 NW Meeks St
- 261 NW Meeks St