1730 Red Fox Rd Placerville, CA 95667
Estimated Value: $560,000 - $940,000
3
Beds
2
Baths
1,795
Sq Ft
$373/Sq Ft
Est. Value
About This Home
This home is located at 1730 Red Fox Rd, Placerville, CA 95667 and is currently estimated at $669,213, approximately $372 per square foot. 1730 Red Fox Rd is a home located in El Dorado County with nearby schools including Sutter's Mill Elementary School, Gold Trail School, and El Dorado High School.
Ownership History
Date
Name
Owned For
Owner Type
Purchase Details
Closed on
Dec 5, 2011
Sold by
Keith Lauren
Bought by
Keith Lauren
Current Estimated Value
Purchase Details
Closed on
May 8, 2006
Sold by
Keith Marc S and Keith Lauren
Bought by
Keith Marc S and Keith Lauren
Home Financials for this Owner
Home Financials are based on the most recent Mortgage that was taken out on this home.
Original Mortgage
$500,000
Outstanding Balance
$287,920
Interest Rate
6.3%
Mortgage Type
Fannie Mae Freddie Mac
Estimated Equity
$381,293
Purchase Details
Closed on
Jun 9, 1999
Sold by
Lynn Bevers Terance and Lynn Ellen Bevers
Bought by
Keith Marc S and Keith Lauren A
Home Financials for this Owner
Home Financials are based on the most recent Mortgage that was taken out on this home.
Original Mortgage
$240,000
Interest Rate
7.01%
Create a Home Valuation Report for This Property
The Home Valuation Report is an in-depth analysis detailing your home's value as well as a comparison with similar homes in the area
Home Values in the Area
Average Home Value in this Area
Purchase History
| Date | Buyer | Sale Price | Title Company |
|---|---|---|---|
| Keith Lauren | -- | None Available | |
| Keith Marc S | -- | First American Title Co | |
| Keith Marc S | $255,000 | Fidelity National Title Co |
Source: Public Records
Mortgage History
| Date | Status | Borrower | Loan Amount |
|---|---|---|---|
| Open | Keith Marc S | $500,000 | |
| Closed | Keith Marc S | $240,000 |
Source: Public Records
Tax History
| Year | Tax Paid | Tax Assessment Tax Assessment Total Assessment is a certain percentage of the fair market value that is determined by local assessors to be the total taxable value of land and additions on the property. | Land | Improvement |
|---|---|---|---|---|
| 2025 | $4,127 | $391,898 | $117,563 | $274,335 |
| 2024 | $4,127 | $384,214 | $115,258 | $268,956 |
| 2023 | $4,045 | $376,682 | $112,999 | $263,683 |
| 2022 | $3,986 | $369,297 | $110,784 | $258,513 |
| 2021 | $3,931 | $362,057 | $108,612 | $253,445 |
| 2020 | $3,877 | $358,346 | $107,499 | $250,847 |
| 2019 | $3,818 | $351,321 | $105,392 | $245,929 |
| 2018 | $3,713 | $344,433 | $103,326 | $241,107 |
| 2017 | $3,649 | $337,680 | $101,300 | $236,380 |
| 2016 | $3,595 | $331,060 | $99,314 | $231,746 |
| 2015 | $3,475 | $326,089 | $97,823 | $228,266 |
| 2014 | $3,475 | $319,703 | $95,907 | $223,796 |
Source: Public Records
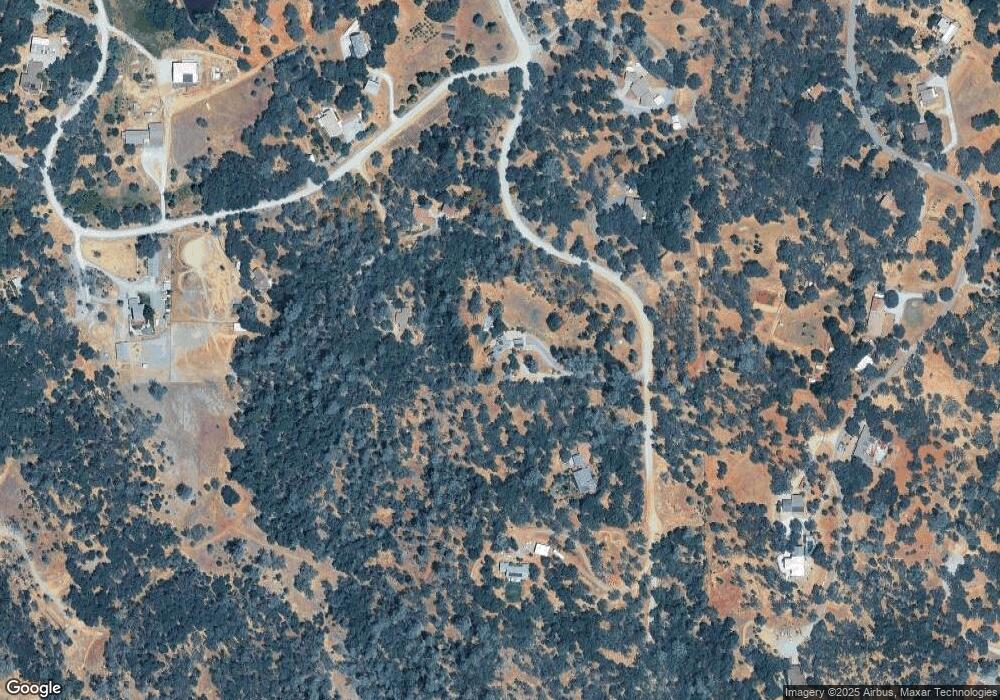
Map
Nearby Homes
- 1700 Shadydale Ln
- 3815 Lakeview Dr
- 4371 Luneman Rd
- 1363 Crooked Mile Ct
- 3901 Luneman Rd
- 4940 Glory View Dr
- 4740 Glory View Dr
- 4890 Thompson Hill Rd
- 4950 Thompson Hill Rd
- 5080 Thompson Hill Rd
- 5050 Glory View Dr
- 0 Lisa Ln Unit 226022265
- 1285 Sierra East Ct
- 1240 Los Robles Rd
- 1110 Trails End Dr
- 4644 Bakers Mountain Rd
- 1105 Burnt Shanty Creek Rd
- 5661 Thompson Hill Rd
- 1261 Jurgens Rd
- 5 Jurgens Rd
- 1760 Red Fox Rd
- 1680 Red Fox Rd
- 1721 Red Fox Rd
- 1794 Red Fox Rd
- 4620 Meadow Creek Rd
- 4631 Meadow Creek Rd
- 1671 Red Fox Rd
- 1820 Red Fox Rd
- 4681 Meadow Creek Rd
- 1680 Shadydale Ln
- 4590 Meadow Creek Rd
- 1660 Shadydale Ln
- 1681 Shadydale Ln
- 1622 Shadydale Ln
- 1840 Red Fox Rd
- 1620 Red Fox Rd
- 1831 Red Fox Rd
- 4601 Meadow Creek Rd
- 1650 Shadydale Ln
- 1641 Red Fox Rd
Your Personal Tour Guide
Ask me questions while you tour the home.