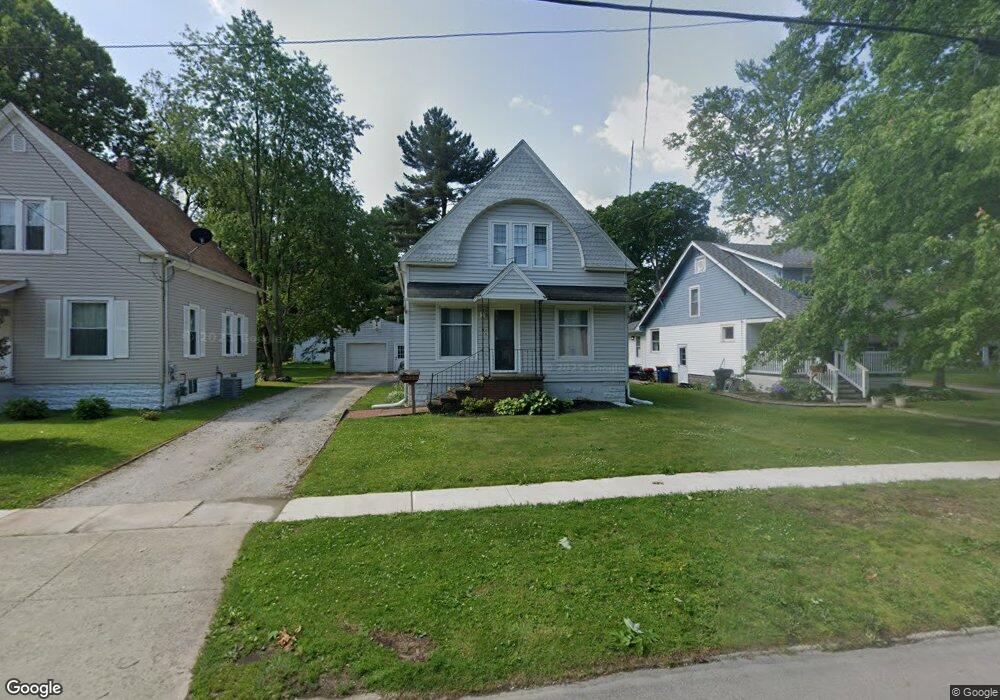
1730 W 13th St Ashtabula, OH 44004
Estimated Value: $142,000 - $176,000
2
Beds
1
Bath
1,080
Sq Ft
$140/Sq Ft
Est. Value
About This Home
This home is located at 1730 W 13th St, Ashtabula, OH 44004 and is currently estimated at $150,687, approximately $139 per square foot. 1730 W 13th St is a home located in Ashtabula County with nearby schools including Lakeside High School and Christian Faith Academy.
Ownership History
Date
Name
Owned For
Owner Type
Purchase Details
Closed on
May 15, 2007
Sold by
Snyder Bruce W and Snyder Kristi A
Bought by
Beebe Sandra K
Current Estimated Value
Home Financials for this Owner
Home Financials are based on the most recent Mortgage that was taken out on this home.
Original Mortgage
$76,500
Outstanding Balance
$46,634
Interest Rate
6.21%
Mortgage Type
Unknown
Estimated Equity
$104,053
Purchase Details
Closed on
Nov 27, 2001
Sold by
Demarco Timothy
Bought by
Snyder Bruce W
Home Financials for this Owner
Home Financials are based on the most recent Mortgage that was taken out on this home.
Original Mortgage
$71,250
Interest Rate
6.62%
Mortgage Type
New Conventional
Purchase Details
Closed on
May 10, 1996
Sold by
Haapala Ina S
Bought by
Demarco Timothy J
Home Financials for this Owner
Home Financials are based on the most recent Mortgage that was taken out on this home.
Original Mortgage
$35,150
Interest Rate
7.78%
Mortgage Type
FHA
Create a Home Valuation Report for This Property
The Home Valuation Report is an in-depth analysis detailing your home's value as well as a comparison with similar homes in the area
Home Values in the Area
Average Home Value in this Area
Purchase History
| Date | Buyer | Sale Price | Title Company |
|---|---|---|---|
| Beebe Sandra K | $85,000 | Chicago Title | |
| Snyder Bruce W | $75,000 | -- | |
| Demarco Timothy J | $34,900 | -- |
Source: Public Records
Mortgage History
| Date | Status | Borrower | Loan Amount |
|---|---|---|---|
| Open | Beebe Sandra K | $76,500 | |
| Previous Owner | Snyder Bruce W | $71,250 | |
| Previous Owner | Demarco Timothy J | $35,150 |
Source: Public Records
Tax History Compared to Growth
Tax History
| Year | Tax Paid | Tax Assessment Tax Assessment Total Assessment is a certain percentage of the fair market value that is determined by local assessors to be the total taxable value of land and additions on the property. | Land | Improvement |
|---|---|---|---|---|
| 2024 | $2,603 | $29,440 | $4,550 | $24,890 |
| 2023 | $1,497 | $29,440 | $4,550 | $24,890 |
| 2022 | $1,361 | $23,420 | $3,500 | $19,920 |
| 2021 | $1,372 | $23,420 | $3,500 | $19,920 |
| 2020 | $1,392 | $23,420 | $3,500 | $19,920 |
| 2019 | $1,289 | $20,590 | $3,750 | $16,840 |
| 2018 | $1,175 | $20,590 | $3,750 | $16,840 |
| 2017 | $1,173 | $20,590 | $3,750 | $16,840 |
| 2016 | $1,150 | $19,320 | $3,500 | $15,820 |
| 2015 | $1,120 | $19,320 | $3,500 | $15,820 |
| 2014 | $1,089 | $19,320 | $3,500 | $15,820 |
| 2013 | $1,250 | $23,870 | $3,220 | $20,650 |
Source: Public Records
Map
Nearby Homes
- 1726 W 13th St
- 1736 W 13th St
- 1722 W 13th St
- 1322 Pennsylvania Ave
- 1716 W 13th St
- 1326 Pennsylvania Ave
- 1806 W 13th St
- 1330 Pennsylvania Ave
- 1327 Michigan Ave
- 1810 W 13th St
- 1725 W 13th St
- 1721 W 13th St
- 1731 W 13th St
- 1711 W 13th St
- 1331 Michigan Ave
- 1321 Pennsylvania Ave
- 1319 Michigan Ave
- 1707 W 13th St
- 1331 Pennsylvania Ave
- 1803 W 13th St