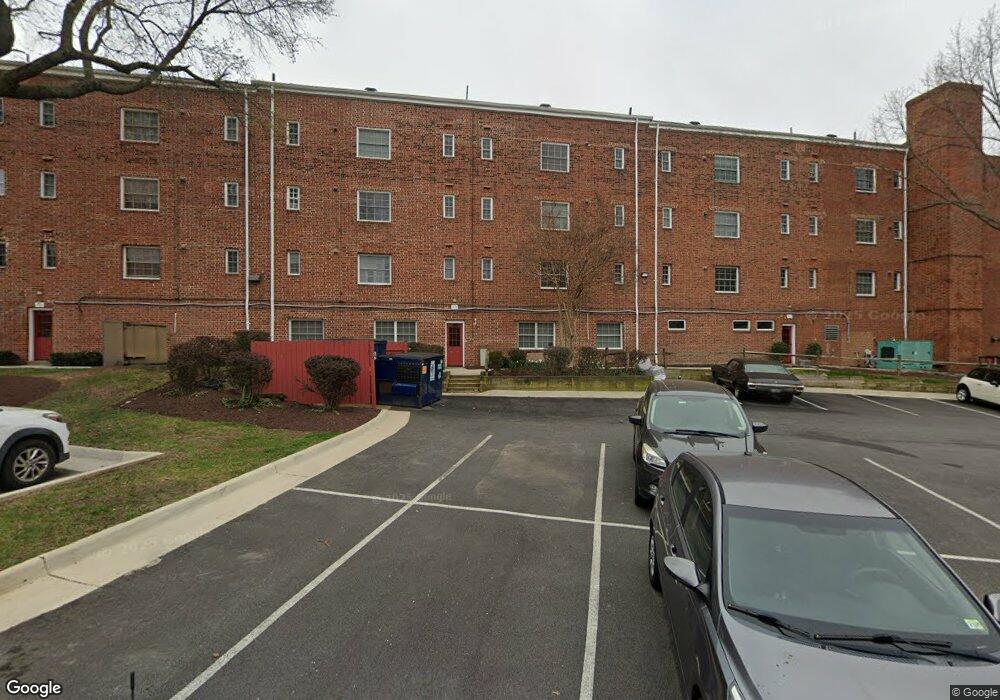
1730 W Abingdon Dr Unit 202 Alexandria, VA 22314
Potomac Yard NeighborhoodEstimated Value: $282,000 - $297,838
1
Bed
1
Bath
610
Sq Ft
$478/Sq Ft
Est. Value
About This Home
This home is located at 1730 W Abingdon Dr Unit 202, Alexandria, VA 22314 and is currently estimated at $291,613, approximately $478 per square foot. 1730 W Abingdon Dr Unit 202 is a home located in Alexandria City with nearby schools including Jefferson-Houston Elementary School, Alexandria City High School, and Potomac Crescent Waldorf School.
Ownership History
Date
Name
Owned For
Owner Type
Purchase Details
Closed on
May 19, 2006
Sold by
Mafc Resid'L Inc
Bought by
French Theano B
Current Estimated Value
Home Financials for this Owner
Home Financials are based on the most recent Mortgage that was taken out on this home.
Original Mortgage
$191,500
Outstanding Balance
$111,035
Interest Rate
6.42%
Mortgage Type
New Conventional
Estimated Equity
$180,578
Purchase Details
Closed on
Jul 14, 2005
Sold by
Baker Mark A
Bought by
Mafc Residential Inc
Home Financials for this Owner
Home Financials are based on the most recent Mortgage that was taken out on this home.
Original Mortgage
$242,600
Interest Rate
5.67%
Mortgage Type
Construction
Purchase Details
Closed on
Aug 27, 1993
Sold by
Abingdon Apts Lp
Bought by
Baker Mark A
Home Financials for this Owner
Home Financials are based on the most recent Mortgage that was taken out on this home.
Original Mortgage
$76,050
Interest Rate
7.06%
Create a Home Valuation Report for This Property
The Home Valuation Report is an in-depth analysis detailing your home's value as well as a comparison with similar homes in the area
Home Values in the Area
Average Home Value in this Area
Purchase History
| Date | Buyer | Sale Price | Title Company |
|---|---|---|---|
| French Theano B | $239,900 | -- | |
| Mafc Residential Inc | $242,600 | -- | |
| Baker Mark A | $78,775 | -- |
Source: Public Records
Mortgage History
| Date | Status | Borrower | Loan Amount |
|---|---|---|---|
| Open | French Theano B | $191,500 | |
| Previous Owner | Mafc Residential Inc | $242,600 | |
| Previous Owner | Baker Mark A | $76,050 |
Source: Public Records
Tax History Compared to Growth
Tax History
| Year | Tax Paid | Tax Assessment Tax Assessment Total Assessment is a certain percentage of the fair market value that is determined by local assessors to be the total taxable value of land and additions on the property. | Land | Improvement |
|---|---|---|---|---|
| 2025 | $3,372 | $297,989 | $100,504 | $197,485 |
| 2024 | $3,372 | $289,310 | $97,577 | $191,733 |
| 2023 | $2,919 | $263,008 | $88,706 | $174,302 |
| 2022 | $2,919 | $263,008 | $88,706 | $174,302 |
| 2021 | $2,979 | $268,377 | $90,517 | $177,860 |
| 2020 | $2,722 | $255,596 | $86,206 | $169,390 |
| 2019 | $2,477 | $219,209 | $73,934 | $145,275 |
| 2018 | $2,389 | $211,427 | $71,780 | $139,647 |
| 2017 | $2,463 | $217,966 | $74,000 | $143,966 |
| 2016 | $2,339 | $217,966 | $74,000 | $143,966 |
| 2015 | $2,320 | $222,418 | $74,000 | $148,418 |
| 2014 | $2,320 | $222,418 | $74,000 | $148,418 |
Source: Public Records
Map
Nearby Homes
- 1675 Hunting Creek Dr
- 1814 W Abingdon Dr Unit 201
- 1612 W Abingdon Dr Unit 202
- 1634 W Abingdon Dr Unit 102
- 725 Carpenter Rd
- 625 Slaters Ln Unit 401
- 625 Slaters Ln Unit G4
- 625 Slaters Ln Unit 201
- 625 Slaters Ln Unit 407
- 625 Slaters Ln Unit 304
- 2004 Potomac Ave
- 635 Slaters Ln Unit 302
- 635 Slaters Ln Unit 109
- 708 Day Ln
- 724 E Howell Ave
- 707 Massey Ln Unit A
- 1820 Potomac Ave
- 1907 Main Line Blvd Unit 101
- 501 Slaters Ln Unit 102
- 501 Slaters Ln Unit 513
- 1730 W Abingdon Dr Unit T2
- 1730 W Abingdon Dr Unit T1
- 1730 W Abingdon Dr Unit 102
- 1730 W Abingdon Dr Unit 301
- 1730 W Abingdon Dr Unit 101
- 1730 W Abingdon Dr Unit 201
- 1730 W Abingdon Dr Unit 1730-T2
- 1671 Hunting Creek Dr
- 1669 Hunting Creek Dr
- 1667 Hunting Creek Dr
- 1673 Hunting Creek Dr
- 1677 Hunting Creek Dr
- 1665 Hunting Creek Dr
- 1663 Hunting Creek Dr
- 1679 Hunting Creek Dr
- 1681 Hunting Creek Dr
- 1683 Hunting Creek Dr
- 1661 Hunting Creek Dr
- 1659 Hunting Creek Dr
- 701 Fitzhugh Way