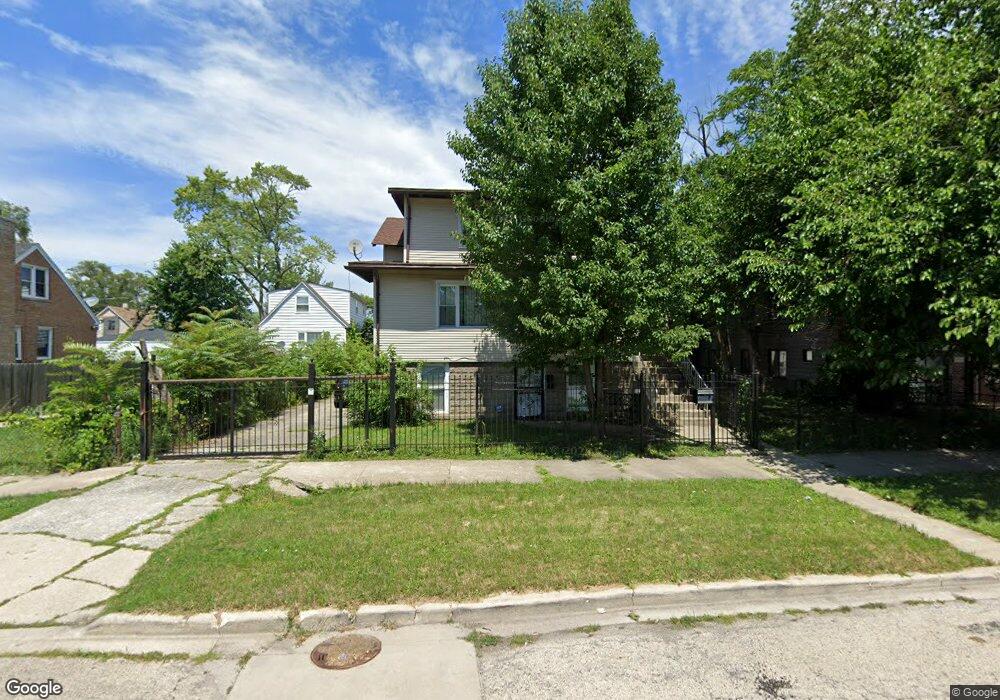
1730 W Edmaire St Chicago, IL 60643
Morgan Park NeighborhoodEstimated Value: $157,000 - $233,000
5
Beds
4
Baths
1,168
Sq Ft
$175/Sq Ft
Est. Value
About This Home
This home is located at 1730 W Edmaire St, Chicago, IL 60643 and is currently estimated at $204,618, approximately $175 per square foot. 1730 W Edmaire St is a home located in Cook County with nearby schools including John D. Shoop Elementary School, Morgan Park High School, and Morgan Park Academy.
Ownership History
Date
Name
Owned For
Owner Type
Purchase Details
Closed on
May 13, 2009
Sold by
Stover Christine
Bought by
Chicago Title Land Trust Company and Trust #8002353515
Current Estimated Value
Purchase Details
Closed on
Nov 11, 2008
Sold by
Gmac Mortgage Llc
Bought by
Stover Christine
Purchase Details
Closed on
Jul 7, 2008
Sold by
Cogwell Derrick
Bought by
Gmac Mortgage Llc
Purchase Details
Closed on
Feb 27, 2006
Sold by
Brantley Sanford
Bought by
Cogwell Derrick and Cogwell Charnese
Home Financials for this Owner
Home Financials are based on the most recent Mortgage that was taken out on this home.
Original Mortgage
$223,920
Interest Rate
9.95%
Mortgage Type
Unknown
Purchase Details
Closed on
Mar 1, 1995
Sold by
Brantley Sanford
Bought by
Brantley Sanford and Brantley Regina
Home Financials for this Owner
Home Financials are based on the most recent Mortgage that was taken out on this home.
Original Mortgage
$40,000
Interest Rate
8.97%
Create a Home Valuation Report for This Property
The Home Valuation Report is an in-depth analysis detailing your home's value as well as a comparison with similar homes in the area
Home Values in the Area
Average Home Value in this Area
Purchase History
| Date | Buyer | Sale Price | Title Company |
|---|---|---|---|
| Chicago Title Land Trust Company | -- | Chicago Title Insurance Co | |
| Stover Christine | $40,000 | First American | |
| Gmac Mortgage Llc | -- | None Available | |
| Cogwell Derrick | $280,000 | None Available | |
| Brantley Sanford | -- | -- |
Source: Public Records
Mortgage History
| Date | Status | Borrower | Loan Amount |
|---|---|---|---|
| Previous Owner | Cogwell Derrick | $223,920 | |
| Previous Owner | Brantley Sanford | $40,000 |
Source: Public Records
Tax History Compared to Growth
Tax History
| Year | Tax Paid | Tax Assessment Tax Assessment Total Assessment is a certain percentage of the fair market value that is determined by local assessors to be the total taxable value of land and additions on the property. | Land | Improvement |
|---|---|---|---|---|
| 2024 | $1,163 | $12,000 | $3,763 | $8,237 |
| 2023 | $1,135 | $5,500 | $3,107 | $2,393 |
| 2022 | $1,135 | $5,500 | $3,107 | $2,393 |
| 2021 | $1,109 | $5,500 | $3,105 | $2,395 |
| 2020 | $1,995 | $8,934 | $4,076 | $4,858 |
| 2019 | $1,978 | $9,818 | $4,076 | $5,742 |
| 2018 | $1,944 | $9,818 | $4,076 | $5,742 |
| 2017 | $2,478 | $11,488 | $3,763 | $7,725 |
| 2016 | $2,306 | $11,488 | $3,763 | $7,725 |
| 2015 | $2,110 | $11,488 | $3,763 | $7,725 |
| 2014 | $2,065 | $11,102 | $3,449 | $7,653 |
| 2013 | $2,024 | $11,102 | $3,449 | $7,653 |
Source: Public Records
Map
Nearby Homes
- 11437 S Watkins Ave
- 1721 W Steuben St
- 1745 W Steuben St
- 11350 S Vincennes Ave
- 11501 S Vincennes Ave
- 11258 S Church St
- 11326 S Homewood Ave
- 11218 S Hermosa Ave
- 11634 S Vincennes Ave
- 11173 S Hermosa Ave
- 1450 W 114th Place
- 2005 W Edmaire St
- 2010 W 115th St
- 11706 S Watkins Ave
- 11625 S Laflin St
- 11200 S Longwood Dr
- 11724 S Laflin St
- 11761 S Vincennes Ave
- 11345 S Ada St
- 11741 S Laflin St
- 1732 W Edmaire St
- 1728 W Edmaire St
- 1740 W Edmaire St
- 1740 W Edmaire St
- 1724 W Edmaire St
- 1724 W Edmaire St
- 1722 W Edmaire St
- 1722 W Edmaire St
- 1716 W Edmaire St
- 1735 W Steuben St
- 1746 W Edmaire St
- 1714 W Edmaire St
- 1719 W Steuben St
- 1739 W Steuben St
- 1750 W Edmaire St
- 1715 W Steuben St
- 11432 S Davol St
- 1743 W Steuben St
- 1752 W Edmaire St