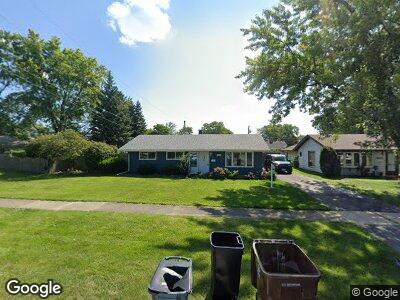
17303 71st Ct Orland Hills, IL 60477
Estimated Value: $240,000 - $258,981
3
Beds
1
Bath
1,170
Sq Ft
$214/Sq Ft
Est. Value
About This Home
This home is located at 17303 71st Ct, Orland Hills, IL 60477 and is currently estimated at $250,495, approximately $214 per square foot. 17303 71st Ct is a home located in Cook County with nearby schools including Fulton Elementary School, Central Middle School, and Tinley Park High School.
Ownership History
Date
Name
Owned For
Owner Type
Purchase Details
Closed on
May 7, 2019
Sold by
Brya Gloria M and Brya James A
Bought by
Grossi Antonio
Current Estimated Value
Home Financials for this Owner
Home Financials are based on the most recent Mortgage that was taken out on this home.
Original Mortgage
$135,000
Interest Rate
5.75%
Mortgage Type
Adjustable Rate Mortgage/ARM
Purchase Details
Closed on
May 4, 2015
Sold by
Brya James A and Bya Gloria M
Bought by
Brya James A and Brya Gloria M
Purchase Details
Closed on
Aug 18, 2008
Sold by
Brya James A
Bought by
Brya James A and Brya Gloria M
Purchase Details
Closed on
Mar 25, 2008
Sold by
Equicredit Corp Of America
Bought by
Brya James
Home Financials for this Owner
Home Financials are based on the most recent Mortgage that was taken out on this home.
Original Mortgage
$119,920
Interest Rate
5.93%
Mortgage Type
Purchase Money Mortgage
Purchase Details
Closed on
Jan 9, 2008
Sold by
Jones Raymond A
Bought by
Equicredit Corp Of America
Create a Home Valuation Report for This Property
The Home Valuation Report is an in-depth analysis detailing your home's value as well as a comparison with similar homes in the area
Home Values in the Area
Average Home Value in this Area
Purchase History
| Date | Buyer | Sale Price | Title Company |
|---|---|---|---|
| Grossi Antonio | $150,000 | None Available | |
| Brya James A | -- | None Available | |
| Brya James A | -- | None Available | |
| Brya James | $150,000 | Multiple | |
| Equicredit Corp Of America | -- | None Available |
Source: Public Records
Mortgage History
| Date | Status | Borrower | Loan Amount |
|---|---|---|---|
| Open | Grossi Antonio | $134,000 | |
| Closed | Grossi Antonio | $135,000 | |
| Previous Owner | Brya James | $119,920 |
Source: Public Records
Tax History Compared to Growth
Tax History
| Year | Tax Paid | Tax Assessment Tax Assessment Total Assessment is a certain percentage of the fair market value that is determined by local assessors to be the total taxable value of land and additions on the property. | Land | Improvement |
|---|---|---|---|---|
| 2024 | $4,716 | $23,825 | $4,259 | $19,566 |
| 2023 | $4,716 | $23,825 | $4,259 | $19,566 |
| 2022 | $4,716 | $18,318 | $3,786 | $14,532 |
| 2021 | $17,912 | $45,817 | $3,786 | $42,031 |
| 2020 | $6,063 | $14,492 | $3,786 | $10,706 |
| 2019 | $6,931 | $16,460 | $3,549 | $12,911 |
| 2018 | $6,859 | $16,460 | $3,549 | $12,911 |
| 2017 | $6,903 | $16,460 | $3,549 | $12,911 |
| 2016 | $4,032 | $14,285 | $3,076 | $11,209 |
| 2015 | $4,153 | $14,285 | $3,076 | $11,209 |
| 2014 | $5,995 | $14,285 | $3,076 | $11,209 |
| 2013 | -- | $15,063 | $3,076 | $11,987 |
Source: Public Records
Map
Nearby Homes
- 17242 71st Ct Unit 4
- 17220 71st Ave Unit 2
- 17349 70th Ave
- 17138 71st Ave Unit 4
- 7026 174th Place
- 17510 71st Ct Unit 2A
- 17525 71st Ct Unit 3C
- 17059 Odell Ave
- 17200 Oak Park Ave Unit R206
- 16949 S Harlem Ave
- 16724 Oak Park Ave
- 7537 175th St Unit 514
- 16914 New England Ave
- 7555 174th St
- 7565 174th St
- 16835 New England Ave
- 6609 173rd Place
- 16750 Harlem Ave
- 16755 New England Ave
- 6649 Hubbard Ln
- 17303 71st Ct
- 17303 71st Ct
- 17309 71st Ct
- 17241 71st Ct
- 17315 71st Ct
- 17235 71st Ct
- 17304 71st Ct
- 17312 71st Ct
- 17304 71st Ave
- 17318 71st Ct
- 17250 71st Ave
- 7128 173rd Place
- 7122 173rd Place
- 17268 71st Ct Unit 2
- 17268 71st Ct Unit 8
- 17268 71st Ct Unit 3
- 17268 71st Ct Unit 10
- 17268 71st Ct Unit 6
- 17268 71st Ct Unit 7
- 17268 71st Ct Unit 5