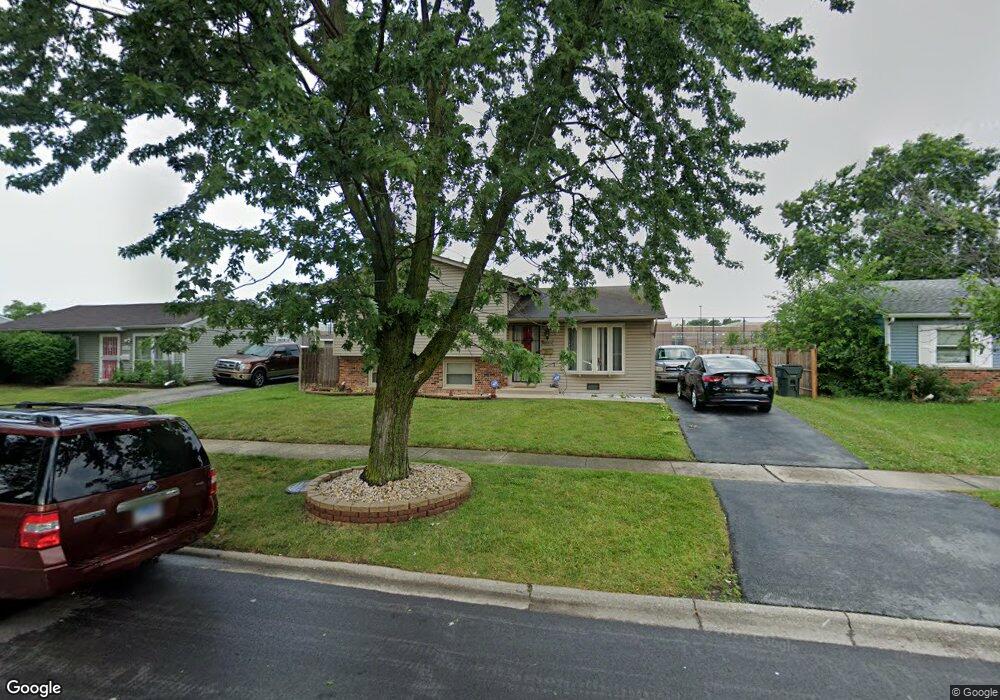
17308 Peach Grove Ln Hazel Crest, IL 60429
Estimated Value: $158,000 - $209,000
3
Beds
2
Baths
1,066
Sq Ft
$175/Sq Ft
Est. Value
About This Home
This home is located at 17308 Peach Grove Ln, Hazel Crest, IL 60429 and is currently estimated at $186,468, approximately $174 per square foot. 17308 Peach Grove Ln is a home located in Cook County with nearby schools including Highlands Elementary School, Prairie-Hills Junior High School, and Hillcrest High School.
Ownership History
Date
Name
Owned For
Owner Type
Purchase Details
Closed on
Sep 1, 2003
Sold by
Suburban Bank & Trust Co
Bought by
Maple Andrea
Current Estimated Value
Purchase Details
Closed on
Dec 28, 1998
Sold by
Howell Shirley
Bought by
St Paul Trust Company and Trust #74-2433
Purchase Details
Closed on
Oct 5, 1998
Sold by
St Paul Trust Company
Bought by
Howell Shirley
Home Financials for this Owner
Home Financials are based on the most recent Mortgage that was taken out on this home.
Original Mortgage
$61,500
Interest Rate
6.9%
Purchase Details
Closed on
Jan 22, 1996
Sold by
Howell Shirley
Bought by
Beverly Trust Company
Purchase Details
Closed on
Nov 9, 1994
Sold by
Jones Sylvester E
Bought by
Howell Shirley
Home Financials for this Owner
Home Financials are based on the most recent Mortgage that was taken out on this home.
Original Mortgage
$60,300
Interest Rate
8.86%
Create a Home Valuation Report for This Property
The Home Valuation Report is an in-depth analysis detailing your home's value as well as a comparison with similar homes in the area
Home Values in the Area
Average Home Value in this Area
Purchase History
| Date | Buyer | Sale Price | Title Company |
|---|---|---|---|
| Maple Andrea | $76,500 | -- | |
| St Paul Trust Company | -- | -- | |
| Howell Shirley | -- | -- | |
| Beverly Trust Company | -- | -- | |
| Howell Shirley | $67,000 | -- |
Source: Public Records
Mortgage History
| Date | Status | Borrower | Loan Amount |
|---|---|---|---|
| Previous Owner | Howell Shirley | $61,500 | |
| Previous Owner | Howell Shirley | $60,300 |
Source: Public Records
Tax History Compared to Growth
Tax History
| Year | Tax Paid | Tax Assessment Tax Assessment Total Assessment is a certain percentage of the fair market value that is determined by local assessors to be the total taxable value of land and additions on the property. | Land | Improvement |
|---|---|---|---|---|
| 2024 | $6,498 | $16,000 | $2,452 | $13,548 |
| 2023 | $4,980 | $16,000 | $2,452 | $13,548 |
| 2022 | $4,980 | $10,204 | $2,102 | $8,102 |
| 2021 | $4,863 | $10,203 | $2,101 | $8,102 |
| 2020 | $4,980 | $10,516 | $2,101 | $8,415 |
| 2019 | $2,641 | $7,373 | $1,926 | $5,447 |
| 2018 | $2,555 | $7,373 | $1,926 | $5,447 |
| 2017 | $2,423 | $7,373 | $1,926 | $5,447 |
| 2016 | $2,805 | $7,294 | $1,751 | $5,543 |
| 2015 | $2,616 | $7,294 | $1,751 | $5,543 |
| 2014 | $1,579 | $7,294 | $1,751 | $5,543 |
| 2013 | $2,511 | $7,872 | $1,751 | $6,121 |
Source: Public Records
Map
Nearby Homes
- 3806 172nd St
- 17303 Appletree Dr
- 3618 Peach Grove Ln
- 17511 Winston Dr Unit 1
- 3800 171st St
- 17126 Orchard Ln
- 17316 Central Park Ave
- 3881 171st St
- 3617 175th Place
- 3512 Woodworth Place
- 4101 Park Ln Unit 1
- 3740 Highland Place
- 7R3 Country Club Ln
- 7R2 Country Club Ln
- 17651 Hillcrest Dr
- 3651 177th St
- 17640 Central Park Ave
- 17700 Springfield Ave
- 16948 Glen Oaks Dr
- 17206 Elm Dr
- 17306 Peach Grove Ln
- 17304 Peach Grove Ln
- 17312 Peach Grove Ln
- 17307 Peach Grove Ln
- 17309 Peach Grove Ln
- 17302 Peach Grove Ln
- 17305 Peach Grove Ln
- 17314 Peach Grove Ln
- 17311 Peach Grove Ln
- 17303 Peach Grove Ln
- 17300 Peach Grove Ln
- 3708 Glynwood Ln
- 17301 Peach Grove Ln
- 3710 Glynwood Ln
- 17316 Peach Grove Ln
- 3712 Glynwood Ln
- 3706 Glynwood Ln
- 17318 Peach Grove Ln
- 17220 Peach Grove Ln
- 3709 Tamarind Ln