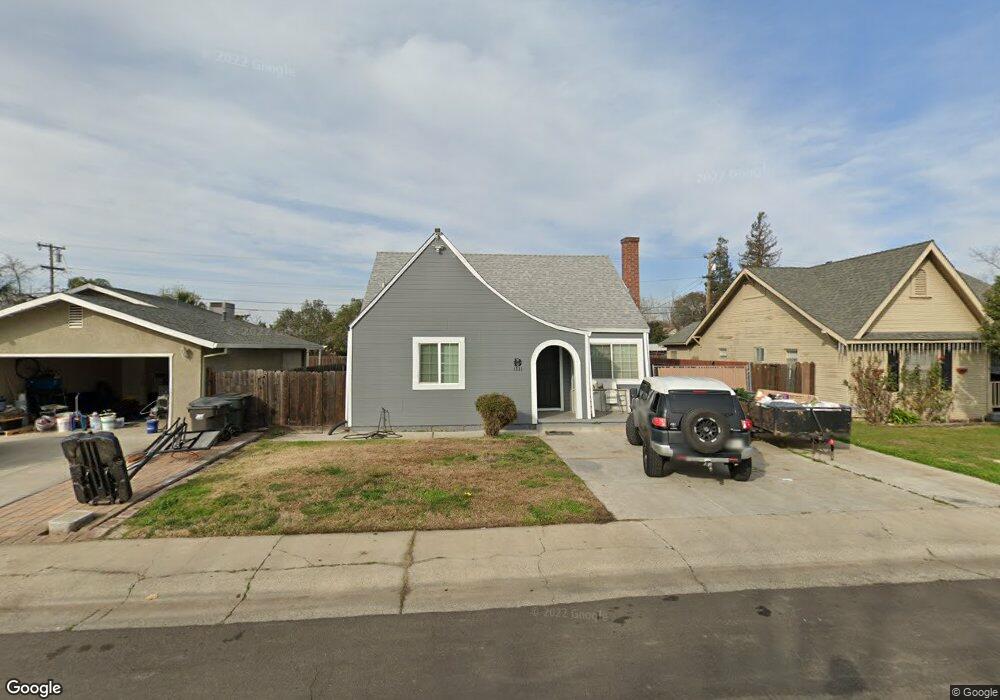
1731 Bristol Ave Stockton, CA 95204
Country Club NeighborhoodEstimated Value: $200,000 - $372,000
2
Beds
1
Bath
890
Sq Ft
$345/Sq Ft
Est. Value
About This Home
This home is located at 1731 Bristol Ave, Stockton, CA 95204 and is currently estimated at $306,746, approximately $344 per square foot. 1731 Bristol Ave is a home located in San Joaquin County with nearby schools including Madison Elementary School, Hoover Elementary School, and Flora Arca Mata.
Ownership History
Date
Name
Owned For
Owner Type
Purchase Details
Closed on
Jul 20, 2011
Sold by
Secretary Of Housing & Urban Development
Bought by
Beckham Roger E
Current Estimated Value
Home Financials for this Owner
Home Financials are based on the most recent Mortgage that was taken out on this home.
Original Mortgage
$67,401
Outstanding Balance
$47,682
Interest Rate
5.12%
Mortgage Type
FHA
Estimated Equity
$259,064
Purchase Details
Closed on
Oct 27, 2010
Sold by
Citimortgage Inc
Bought by
The Secretary Of Housing & Urban Develop
Purchase Details
Closed on
Jul 27, 2003
Sold by
Abdallah Maryanne
Bought by
Nelson Zachary and Nelson Tamara
Home Financials for this Owner
Home Financials are based on the most recent Mortgage that was taken out on this home.
Original Mortgage
$145,713
Interest Rate
5.13%
Mortgage Type
FHA
Purchase Details
Closed on
Dec 13, 1993
Sold by
Scott Danny Adriel and Scott Susan Herman
Bought by
Abdallah Maryanne
Create a Home Valuation Report for This Property
The Home Valuation Report is an in-depth analysis detailing your home's value as well as a comparison with similar homes in the area
Home Values in the Area
Average Home Value in this Area
Purchase History
| Date | Buyer | Sale Price | Title Company |
|---|---|---|---|
| Beckham Roger E | $63,000 | Chicago Title Company | |
| The Secretary Of Housing & Urban Develop | -- | Cr Title Services Inc | |
| Citimortgage Inc | $148,821 | Cr Title Services Inc | |
| Nelson Zachary | $148,000 | Financial Title Co Stkn | |
| Abdallah Maryanne | $80,000 | Old Republic Title Company |
Source: Public Records
Mortgage History
| Date | Status | Borrower | Loan Amount |
|---|---|---|---|
| Open | Beckham Roger E | $67,401 | |
| Previous Owner | Nelson Zachary | $145,713 | |
| Closed | Nelson Zachary | $8,880 |
Source: Public Records
Tax History Compared to Growth
Tax History
| Year | Tax Paid | Tax Assessment Tax Assessment Total Assessment is a certain percentage of the fair market value that is determined by local assessors to be the total taxable value of land and additions on the property. | Land | Improvement |
|---|---|---|---|---|
| 2025 | $1,872 | $79,123 | $18,838 | $60,285 |
| 2024 | $1,405 | $77,572 | $18,469 | $59,103 |
| 2023 | $1,338 | $76,052 | $18,107 | $57,945 |
| 2022 | $1,630 | $74,561 | $17,752 | $56,809 |
| 2021 | $1,617 | $73,100 | $17,404 | $55,696 |
| 2020 | $1,375 | $72,351 | $17,226 | $55,125 |
| 2019 | $1,742 | $70,934 | $16,889 | $54,045 |
| 2018 | $1,224 | $69,544 | $16,558 | $52,986 |
| 2017 | $1,445 | $68,182 | $16,234 | $51,948 |
| 2016 | $1,191 | $66,844 | $15,915 | $50,929 |
| 2014 | $1,060 | $64,551 | $15,369 | $49,182 |
Source: Public Records
Map
Nearby Homes
- 1705 Bristol Ave
- 1763 Michigan Ave
- 1825 Michigan Ave
- 1812 W Monterey Ave
- 1511 Elmwood Ave
- 1526 W Monterey Ave
- 1605 W Mendocino Ave
- 1940 Elmwood Ave
- 1750 W Alpine Ave
- 1201 Oxford Way
- 3555 Grange Ave
- 2016 Elmwood Ave
- 1545 W Walnut St
- 4424 Ijams Lot 2 Rd
- 4424 Ijams Lot 3 Rd
- 1147 Elmwood Ave
- 2043 Middlefield Ave
- 2047 Country Club Blvd
- 3319 N Pershing Ave
- 1618 Princeton Ave
- 1735 Bristol Ave
- 1723 Bristol Ave
- 1749 Bristol Ave
- 1715 Bristol Ave
- 1722 Michigan Ave
- 1720 Michigan Ave
- 1740 Michigan Ave
- 1755 Bristol Ave
- 1748 Michigan Ave
- 1718 Michigan Ave
- 1732 Bristol Ave
- 1724 Bristol Ave
- 1752 Michigan Ave
- 1748 Bristol Ave
- 1757 Bristol Ave
- 1716 Bristol Ave
- 2735 Grange Ave
- 1754 Bristol Ave
- 1754 Michigan Ave
- 2633 Grange Ave