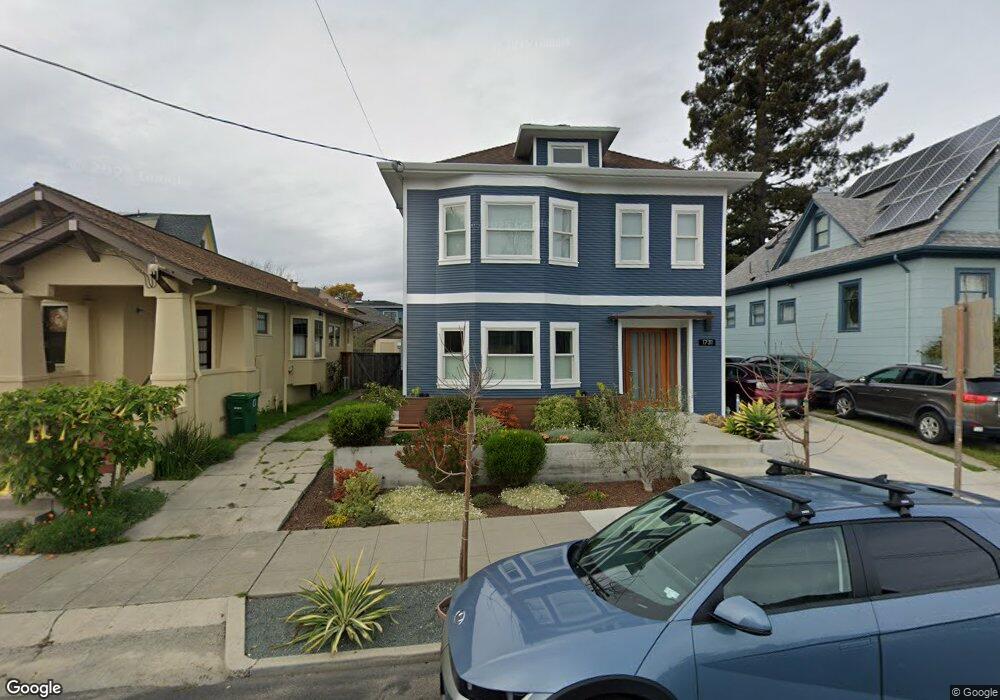
1731 Channing Way Berkeley, CA 94703
Downtown Berkeley NeighborhoodEstimated Value: $1,137,000 - $1,510,000
3
Beds
2
Baths
1,402
Sq Ft
$984/Sq Ft
Est. Value
About This Home
This home is located at 1731 Channing Way, Berkeley, CA 94703 and is currently estimated at $1,378,919, approximately $983 per square foot. 1731 Channing Way is a home located in Alameda County with nearby schools including Washington Elementary School, Malcolm X Elementary School, and Berkeley Arts Magnet at Whittier School.
Ownership History
Date
Name
Owned For
Owner Type
Purchase Details
Closed on
Aug 28, 2018
Sold by
Foley Jill D and Zakim Thomas E
Bought by
Foley Jill D and Zakim Thomas E
Current Estimated Value
Home Financials for this Owner
Home Financials are based on the most recent Mortgage that was taken out on this home.
Original Mortgage
$636,000
Outstanding Balance
$553,487
Interest Rate
4.5%
Mortgage Type
New Conventional
Estimated Equity
$825,432
Purchase Details
Closed on
Feb 24, 2004
Sold by
Linehan James B and Kasahara Rika
Bought by
Zakim Thomas E and Foley Jill D
Home Financials for this Owner
Home Financials are based on the most recent Mortgage that was taken out on this home.
Original Mortgage
$420,800
Interest Rate
4.62%
Mortgage Type
Purchase Money Mortgage
Purchase Details
Closed on
Sep 30, 1997
Sold by
Roberts Yoshiko T and Roberts Yoshiko
Bought by
Linehan James B
Home Financials for this Owner
Home Financials are based on the most recent Mortgage that was taken out on this home.
Original Mortgage
$175,900
Interest Rate
7.44%
Create a Home Valuation Report for This Property
The Home Valuation Report is an in-depth analysis detailing your home's value as well as a comparison with similar homes in the area
Home Values in the Area
Average Home Value in this Area
Purchase History
| Date | Buyer | Sale Price | Title Company |
|---|---|---|---|
| Foley Jill D | -- | Stewart Title Of California | |
| Zakim Thomas E | $526,000 | Placer Title Company | |
| Linehan James B | $220,000 | Placer Title Company |
Source: Public Records
Mortgage History
| Date | Status | Borrower | Loan Amount |
|---|---|---|---|
| Open | Foley Jill D | $636,000 | |
| Closed | Zakim Thomas E | $420,800 | |
| Previous Owner | Linehan James B | $175,900 | |
| Closed | Zakim Thomas E | $52,600 |
Source: Public Records
Tax History
| Year | Tax Paid | Tax Assessment Tax Assessment Total Assessment is a certain percentage of the fair market value that is determined by local assessors to be the total taxable value of land and additions on the property. | Land | Improvement |
|---|---|---|---|---|
| 2025 | $16,526 | $998,818 | $224,345 | $781,473 |
| 2024 | $16,526 | $968,158 | $219,947 | $755,211 |
| 2023 | $16,198 | $958,383 | $215,635 | $742,748 |
| 2022 | $15,788 | $925,691 | $211,407 | $714,284 |
| 2021 | $13,579 | $690,878 | $207,263 | $483,615 |
| 2020 | $10,473 | $683,800 | $205,140 | $478,660 |
| 2019 | $10,069 | $670,391 | $201,117 | $469,274 |
| 2018 | $9,902 | $657,247 | $197,174 | $460,073 |
| 2017 | $9,549 | $644,360 | $193,308 | $451,052 |
| 2016 | $9,248 | $631,725 | $189,517 | $442,208 |
| 2015 | $9,126 | $622,236 | $186,671 | $435,565 |
| 2014 | $9,066 | $610,048 | $183,014 | $427,034 |
Source: Public Records
Map
Nearby Homes
- 1645 Dwight Way
- 1901 Parker St Unit 3
- 1612 Parker St
- 2218 -2222 Grant St
- 2350 Sacramento St
- 1612 Carleton St
- 2701 Grant St
- 2018 Blake St
- 2118 California St
- 1515 Derby St
- 2750 Sacramento St
- 1450 Ward St
- 1530 Stuart St
- 2758 Sacramento St
- 2774 Sacramento St
- 2782 Sacramento St
- 2790 Sacramento St
- 1813 Sacramento St
- 2324 Browning St
- 2926 Ellis St
- 1729 Channing Way
- 1733 Channing Way
- 1735 Channing Way
- 2343 Roosevelt Ave
- 1727 Channing Way
- 2341 Roosevelt Ave
- 2341 Roosevelt Ave Unit 1
- 2341 Roosevelt Ave Unit 2
- 2335 Roosevelt Ave
- 1737 Channing Way
- 1736 Channing Way
- 2331 Roosevelt Ave
- 2400 Grant St
- 1734 Channing Way
- 1732 Channing Way
- 2329 Roosevelt Ave
- 1728 Channing Way
- 2404 Grant St
- 2334 Grant St
- 2340 Roosevelt Ave
Your Personal Tour Guide
Ask me questions while you tour the home.