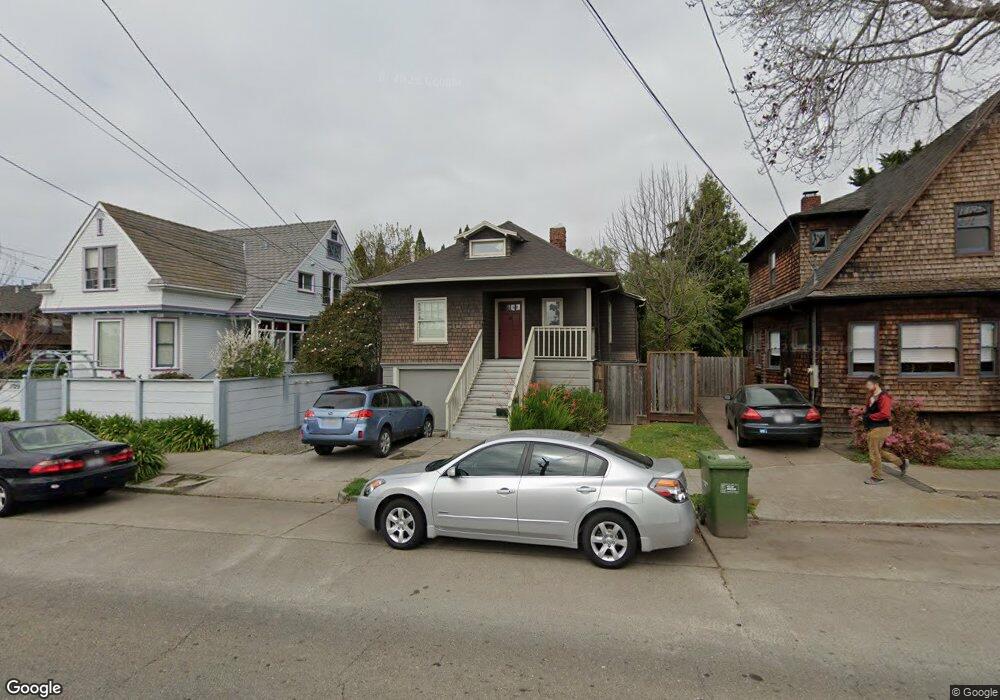
1731 Dwight Way Berkeley, CA 94703
Downtown Berkeley NeighborhoodEstimated Value: $818,000 - $1,199,000
1
Bed
1
Bath
510
Sq Ft
$2,022/Sq Ft
Est. Value
About This Home
Property Id: 682222
•Included in $1997 = heat; gas; electric; water; adjacent (same floor) full-sized washer and dryer; high-speed wireless Internet; cable TV; garbage/recycling/compost; yard maintenance
•Private entrance; porcelain tile floors throughout
•Office (or breakfast) nook and kitchen windows look out to patio and landscaped yard
•Stainless steel stove, dishwasher, microwave, refrigerator
•Natural stone countertops, stainless sink, maple cabinets
•Full-size porcelain tub, tiled shower, new vanity
•Very easy street parking
•Quiet small well-behaved pet welcome with pet deposit
•Fun, convenient central Berkeley neighborhood!
•Lease is 1 year or 18 months
Ownership History
Date
Name
Owned For
Owner Type
Purchase Details
Closed on
Nov 5, 2001
Sold by
Cesario Moses and Cesario Allyson C
Bought by
Rawley Ann K
Current Estimated Value
Home Financials for this Owner
Home Financials are based on the most recent Mortgage that was taken out on this home.
Original Mortgage
$275,000
Outstanding Balance
$107,563
Interest Rate
6.73%
Estimated Equity
$923,793
Purchase Details
Closed on
Sep 20, 2000
Sold by
Moses Cesario Allyson C and Moses Cesario
Bought by
Cesario Moses and Cesario Allyson C
Create a Home Valuation Report for This Property
The Home Valuation Report is an in-depth analysis detailing your home's value as well as a comparison with similar homes in the area
Home Values in the Area
Average Home Value in this Area
Purchase History
| Date | Buyer | Sale Price | Title Company |
|---|---|---|---|
| Rawley Ann K | $345,000 | First California Title Compa | |
| Cesario Moses | -- | -- |
Source: Public Records
Mortgage History
| Date | Status | Borrower | Loan Amount |
|---|---|---|---|
| Open | Rawley Ann K | $275,000 |
Source: Public Records
Property History
| Date | Event | Price | List to Sale | Price per Sq Ft |
|---|---|---|---|---|
| 11/30/2025 11/30/25 | Off Market | $1,997 | -- | -- |
| 11/15/2025 11/15/25 | For Rent | $1,997 | -- | -- |
Tax History
| Year | Tax Paid | Tax Assessment Tax Assessment Total Assessment is a certain percentage of the fair market value that is determined by local assessors to be the total taxable value of land and additions on the property. | Land | Improvement |
|---|---|---|---|---|
| 2025 | $9,413 | $495,642 | $152,890 | $349,752 |
| 2024 | $9,413 | $485,789 | $149,892 | $342,897 |
| 2023 | $9,198 | $483,128 | $146,954 | $336,174 |
| 2022 | $8,988 | $466,656 | $144,073 | $329,583 |
| 2021 | $8,980 | $457,369 | $141,248 | $323,121 |
| 2020 | $8,383 | $459,607 | $139,800 | $319,807 |
| 2019 | $7,929 | $450,597 | $137,059 | $313,538 |
| 2018 | $7,769 | $441,764 | $134,373 | $307,391 |
| 2017 | $7,489 | $433,103 | $131,738 | $301,365 |
| 2016 | $7,165 | $424,613 | $129,156 | $295,457 |
| 2015 | $7,056 | $418,237 | $127,217 | $291,020 |
| 2014 | $6,975 | $410,047 | $124,725 | $285,322 |
Source: Public Records
Map
Nearby Homes
- 1645 Dwight Way
- 1901 Parker St Unit 3
- 1612 Parker St
- 2701 Grant St
- 1612 Carleton St
- 2018 Blake St
- 1515 Derby St
- 2350 Sacramento St
- 1530 Stuart St
- 2218 -2222 Grant St
- 2750 Sacramento St
- 1450 Ward St
- 2758 Sacramento St
- 2774 Sacramento St
- 2782 Sacramento St
- 2790 Sacramento St
- 2118 California St
- 2926 Ellis St
- 1535 Julia St
- 1646 Ashby Ave
- 1729 Dwight Way
- 1733 Dwight Way
- 2439 Roosevelt Ave
- 1739 Dwight Way
- 2437 Roosevelt Ave
- 2435 Roosevelt Ave
- 2442 Grant St Unit 1
- 2442 Grant St Unit 3
- 2442 Grant St Unit A
- 2442 Grant St
- 2448 Grant St
- 2446 Grant St
- 2440 Grant St
- 1730 Dwight Way
- 1728 Dwight Way
- 1732 Dwight Way
- 2433 Roosevelt Ave
- 1726 Dwight Way
- 1736 Dwight Way
- 2440 Roosevelt Ave
Your Personal Tour Guide
Ask me questions while you tour the home.