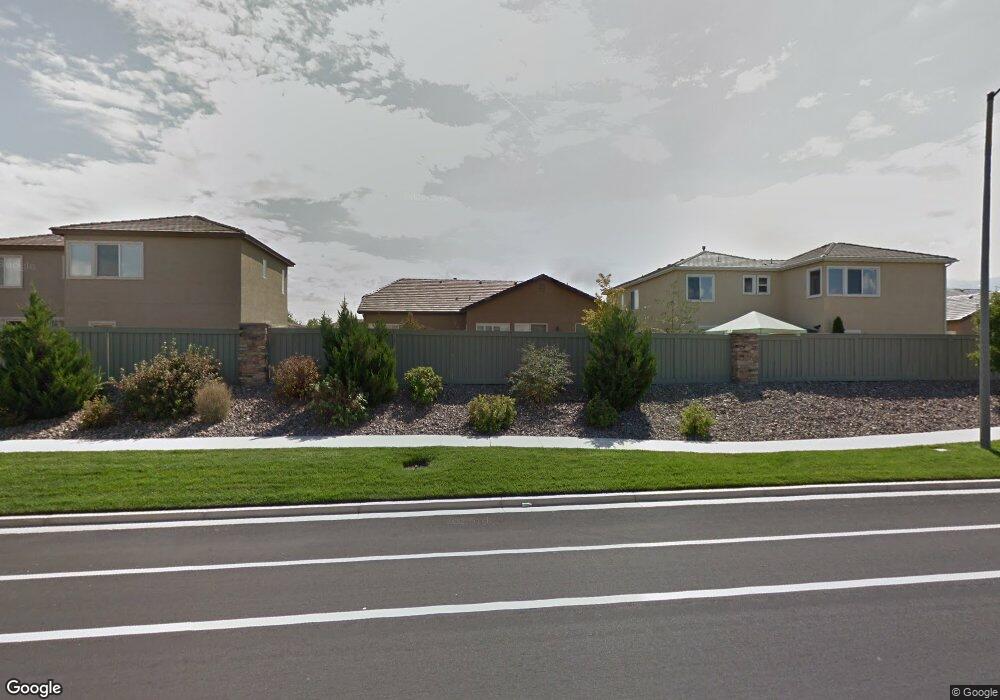
1731 Emerald Bay Dr Reno, NV 89521
Double Diamond NeighborhoodEstimated Value: $524,753 - $556,000
3
Beds
2
Baths
1,398
Sq Ft
$386/Sq Ft
Est. Value
About This Home
This home is located at 1731 Emerald Bay Dr, Reno, NV 89521 and is currently estimated at $539,438, approximately $385 per square foot. 1731 Emerald Bay Dr is a home located in Washoe County with nearby schools including Double Diamond Elementary School, Kendyl Depoali Middle School, and Damonte Ranch High School.
Ownership History
Date
Name
Owned For
Owner Type
Purchase Details
Closed on
Nov 11, 2014
Sold by
Mccloskey Sandra J
Bought by
Mccloskey Sandra J and Sandra J Mccloskey Revocable Living Trus
Current Estimated Value
Purchase Details
Closed on
Jan 10, 2013
Sold by
Mccloskey Sandra J
Bought by
Mccloskey Sandra J
Home Financials for this Owner
Home Financials are based on the most recent Mortgage that was taken out on this home.
Original Mortgage
$160,300
Outstanding Balance
$30,821
Interest Rate
3.53%
Mortgage Type
New Conventional
Estimated Equity
$508,617
Purchase Details
Closed on
Jul 30, 2012
Sold by
Mccloskey Sandra J
Bought by
Mccloskey Sandra J and Sandra J Mccloskey Revocable Living Trus
Purchase Details
Closed on
Nov 14, 2002
Sold by
Ryder Dd Ranch Ltd Partnership
Bought by
Mccloskey Sandra J
Home Financials for this Owner
Home Financials are based on the most recent Mortgage that was taken out on this home.
Original Mortgage
$143,760
Interest Rate
5.95%
Create a Home Valuation Report for This Property
The Home Valuation Report is an in-depth analysis detailing your home's value as well as a comparison with similar homes in the area
Home Values in the Area
Average Home Value in this Area
Purchase History
| Date | Buyer | Sale Price | Title Company |
|---|---|---|---|
| Mccloskey Sandra J | -- | None Available | |
| Mccloskey Sandra J | -- | None Available | |
| Mccloskey Sandra J | -- | None Available | |
| Mccloskey Sandra J | $179,701 | Stewart Title Northern Nevad |
Source: Public Records
Mortgage History
| Date | Status | Borrower | Loan Amount |
|---|---|---|---|
| Open | Mccloskey Sandra J | $160,300 | |
| Closed | Mccloskey Sandra J | $143,760 | |
| Closed | Mccloskey Sandra J | $17,690 |
Source: Public Records
Tax History Compared to Growth
Tax History
| Year | Tax Paid | Tax Assessment Tax Assessment Total Assessment is a certain percentage of the fair market value that is determined by local assessors to be the total taxable value of land and additions on the property. | Land | Improvement |
|---|---|---|---|---|
| 2025 | $2,613 | $110,047 | $44,450 | $65,597 |
| 2024 | $2,613 | $102,211 | $36,050 | $66,161 |
| 2023 | $2,539 | $105,674 | $43,155 | $62,519 |
| 2022 | $2,465 | $85,175 | $33,110 | $52,065 |
| 2021 | $2,393 | $78,604 | $26,810 | $51,794 |
| 2020 | $2,321 | $78,714 | $26,810 | $51,904 |
| 2019 | $2,255 | $75,055 | $25,410 | $49,645 |
| 2018 | $2,185 | $68,719 | $20,125 | $48,594 |
| 2017 | $2,124 | $66,615 | $17,955 | $48,660 |
| 2016 | $2,054 | $65,474 | $17,290 | $48,184 |
| 2015 | $2,052 | $63,084 | $15,225 | $47,859 |
| 2014 | $1,993 | $58,964 | $12,775 | $46,189 |
| 2013 | -- | $55,704 | $10,360 | $45,344 |
Source: Public Records
Map
Nearby Homes
- 1681 Emerald Bay Dr
- 1651 Emerald Bay Dr
- 1781 Emerald Bay Dr
- 1640 Rocky Cove Ln
- 10492 Gold Trail Dr
- 1390 S Fox Glen Ct
- 10400 Rockport Ln
- 10583 Crystal Bay Dr
- 10560 Vista Alta Dr
- 1612 Mountain Ln
- 10316 Sterling View Ct
- 10235 Robilee Dr
- 10145 Donner Peak Dr
- 10050 Goler Wash Ct
- 1485 Wild Wolf Way
- 1680 Cattlemen Ct
- 10375 Rosemount Dr
- 1720 Colavita Way
- 10320 Rosemount Dr
- 9756 Ripple Way
- 1721 Emerald Bay Dr
- 1741 Emerald Bay Dr
- 1711 Emerald Bay Dr
- 1751 Emerald Bay Dr
- 10501 Yuba Ct
- 1720 Emerald Bay Dr
- 1761 Emerald Bay Dr
- 1710 Emerald Bay Dr
- 10584 Iron Point Cir
- 10576 Iron Point Cir
- 1714 Burwood Cir
- 10500 Yuba Ct
- 1712 Burwood Cir
- 1710 Burwood Cir
- 10512 French Meadows Way
- 10508 Yuba Ct
- 1771 Emerald Bay Dr
- 10517 Yuba Ct
- 10592 Iron Point Cir
- 1716 Burwood Cir