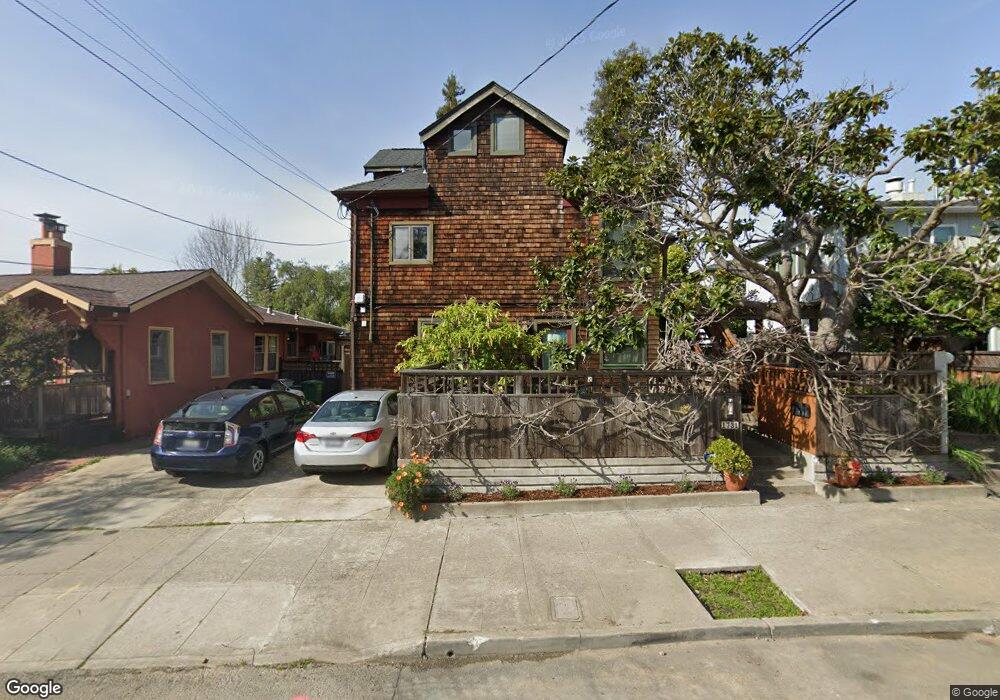
1731 Francisco St Berkeley, CA 94703
North Berkeley NeighborhoodEstimated Value: $1,043,121 - $1,322,000
3
Beds
2
Baths
1,247
Sq Ft
$915/Sq Ft
Est. Value
About This Home
This home is located at 1731 Francisco St, Berkeley, CA 94703 and is currently estimated at $1,141,530, approximately $915 per square foot. 1731 Francisco St is a home located in Alameda County with nearby schools including Berkeley Arts Magnet at Whittier School, Washington Elementary School, and Oxford Elementary School.
Ownership History
Date
Name
Owned For
Owner Type
Purchase Details
Closed on
Mar 20, 2017
Sold by
Vanarsdale Peter
Bought by
Cross Patricia Wang and Wang Keli
Current Estimated Value
Home Financials for this Owner
Home Financials are based on the most recent Mortgage that was taken out on this home.
Original Mortgage
$550,000
Outstanding Balance
$455,963
Interest Rate
4.16%
Mortgage Type
New Conventional
Estimated Equity
$685,567
Purchase Details
Closed on
Mar 17, 2017
Sold by
Cross Michael
Bought by
Cross Patricia Wang
Home Financials for this Owner
Home Financials are based on the most recent Mortgage that was taken out on this home.
Original Mortgage
$550,000
Outstanding Balance
$455,963
Interest Rate
4.16%
Mortgage Type
New Conventional
Estimated Equity
$685,567
Purchase Details
Closed on
Jan 20, 2009
Sold by
London Barbara and Fine Robin L
Bought by
Gittler Susan W
Create a Home Valuation Report for This Property
The Home Valuation Report is an in-depth analysis detailing your home's value as well as a comparison with similar homes in the area
Home Values in the Area
Average Home Value in this Area
Purchase History
| Date | Buyer | Sale Price | Title Company |
|---|---|---|---|
| Cross Patricia Wang | $950,000 | Chicago Title Company | |
| Cross Patricia Wang | -- | Chicago Title Company | |
| Gittler Susan W | -- | Placer Title Company |
Source: Public Records
Mortgage History
| Date | Status | Borrower | Loan Amount |
|---|---|---|---|
| Open | Cross Patricia Wang | $550,000 |
Source: Public Records
Tax History
| Year | Tax Paid | Tax Assessment Tax Assessment Total Assessment is a certain percentage of the fair market value that is determined by local assessors to be the total taxable value of land and additions on the property. | Land | Improvement |
|---|---|---|---|---|
| 2025 | $15,111 | $1,102,531 | $330,759 | $771,772 |
| 2024 | $15,111 | $1,080,918 | $324,275 | $756,643 |
| 2023 | $14,817 | $1,059,724 | $317,917 | $741,807 |
| 2022 | $14,597 | $1,038,947 | $311,684 | $727,263 |
| 2021 | $14,662 | $1,018,580 | $305,574 | $713,006 |
| 2020 | $13,991 | $1,008,140 | $302,442 | $705,698 |
| 2019 | $13,567 | $988,380 | $296,514 | $691,866 |
| 2018 | $13,368 | $969,000 | $290,700 | $678,300 |
| 2017 | $8,094 | $559,536 | $167,861 | $391,675 |
| 2016 | $7,846 | $548,566 | $164,570 | $383,996 |
| 2015 | $7,743 | $540,329 | $162,099 | $378,230 |
| 2014 | $7,694 | $529,749 | $158,925 | $370,824 |
Source: Public Records
Map
Nearby Homes
- 1716 Hearst Ave
- 1625 Martin Luther King jr Way
- 1609 Bonita Ave Unit 5
- 1610 Milvia St
- 2112 Mckinley Ave Unit D
- 2218 -2222 Grant St
- 1425 Martin Luther King jr Way
- 2118 California St
- 1408 Henry St
- 1368 Rose St
- 1578 Allston Way
- 1626 Hopkins St
- 1682 Oxford St
- 2201 Virginia St Unit 2
- 1444 Walnut St
- 1718 Bancroft Way
- 1322 Virginia St
- 1739 Spruce St
- 1515 Oxford St Unit 1D
- 1631 Belvedere Ave
- 1731 Francisco St Unit C
- 1731 Francisco St Unit A
- 1731 Francisco St
- 1731 Francisco St
- 1729 Francisco St
- 1733 Francisco St Unit A
- 1733 Francisco St Unit D
- 1733 Francisco St
- 1733 Francisco St
- 1733 Francisco St Unit C
- 1733 Francisco St Unit B
- 1721 Francisco St
- 1737 Francisco St
- 1726 Virginia St
- 1730 Virginia St
- 1717 Francisco St
- 1722 Virginia St
- 1732 Virginia St
- 1738 Virginia St
- 1720 Virginia St
Your Personal Tour Guide
Ask me questions while you tour the home.