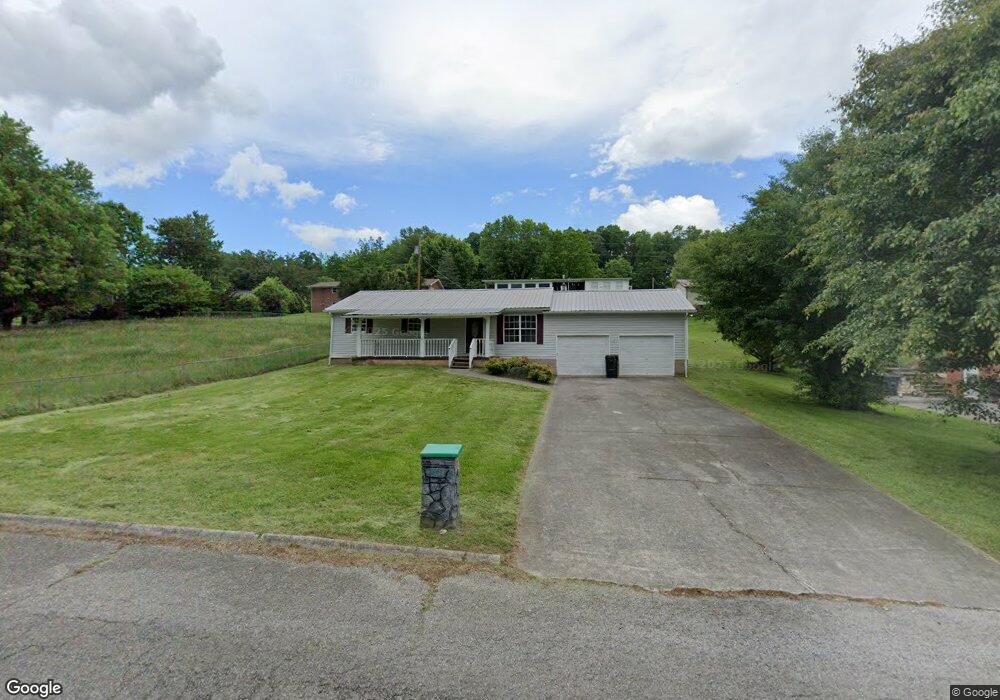
1731 Pembrook Dr Morristown, TN 37813
Estimated Value: $199,000 - $281,000
2
Beds
2
Baths
1,148
Sq Ft
$213/Sq Ft
Est. Value
About This Home
This home is located at 1731 Pembrook Dr, Morristown, TN 37813 and is currently estimated at $244,333, approximately $212 per square foot. 1731 Pembrook Dr is a home located in Hamblen County with nearby schools including Union Heights Elementary School, East Ridge Middle School, and Morristown East High School.
Ownership History
Date
Name
Owned For
Owner Type
Purchase Details
Closed on
May 10, 2007
Sold by
Sub Griffin Denise D
Bought by
Americas Choice Properties Llc
Current Estimated Value
Purchase Details
Closed on
Apr 4, 2005
Sold by
Berry Leland
Bought by
Strange Mark A
Home Financials for this Owner
Home Financials are based on the most recent Mortgage that was taken out on this home.
Original Mortgage
$70,880
Interest Rate
5.74%
Purchase Details
Closed on
Jun 17, 2003
Sold by
Berry Linda
Bought by
Berry Leland
Purchase Details
Closed on
May 2, 1997
Bought by
Berry Leland and Berry Linda
Purchase Details
Closed on
Nov 24, 1996
Bought by
Hurst Rufe and Hurst Gina
Purchase Details
Closed on
Sep 28, 1982
Bought by
Adams Samuel F and Adams Nancy L
Purchase Details
Closed on
Mar 26, 1977
Bought by
Morris Melvin D and Morris Judy
Create a Home Valuation Report for This Property
The Home Valuation Report is an in-depth analysis detailing your home's value as well as a comparison with similar homes in the area
Home Values in the Area
Average Home Value in this Area
Purchase History
| Date | Buyer | Sale Price | Title Company |
|---|---|---|---|
| Americas Choice Properties Llc | $80,000 | -- | |
| Strange Mark A | $88,600 | -- | |
| Berry Leland | -- | -- | |
| Berry Leland | $7,500 | -- | |
| Hurst Rufe | $60,000 | -- | |
| Adams Samuel F | -- | -- | |
| Morris Melvin D | -- | -- |
Source: Public Records
Mortgage History
| Date | Status | Borrower | Loan Amount |
|---|---|---|---|
| Previous Owner | Morris Melvin D | $70,880 |
Source: Public Records
Tax History Compared to Growth
Tax History
| Year | Tax Paid | Tax Assessment Tax Assessment Total Assessment is a certain percentage of the fair market value that is determined by local assessors to be the total taxable value of land and additions on the property. | Land | Improvement |
|---|---|---|---|---|
| 2024 | $565 | $28,700 | $3,725 | $24,975 |
| 2023 | $565 | $28,700 | $0 | $0 |
| 2022 | $565 | $28,700 | $3,725 | $24,975 |
| 2021 | $565 | $28,700 | $3,725 | $24,975 |
| 2020 | $565 | $28,700 | $3,725 | $24,975 |
| 2019 | $551 | $25,875 | $3,125 | $22,750 |
| 2018 | $551 | $25,875 | $3,125 | $22,750 |
| 2017 | $551 | $25,875 | $3,125 | $22,750 |
| 2016 | $515 | $25,875 | $3,125 | $22,750 |
| 2015 | $479 | $25,875 | $3,125 | $22,750 |
| 2014 | -- | $25,875 | $3,125 | $22,750 |
| 2013 | -- | $27,725 | $0 | $0 |
Source: Public Records
Map
Nearby Homes
- 1744 Carroll Rd
- 1496 Dover Rd
- 2137 Highview Dr
- 1148 George Byrd Rd
- 1689 Carroll Rd
- 4271 Stansberry Rd
- 2205 Kingswood Dr
- 2840-2830 Robinson Creek Rd
- 1342 Slop Creek Rd
- 4581 Lockley Ct
- 4270 Brockland Dr
- 4705 E Hampton Blvd
- 3661 Halifax Cir
- 3080 Chucky River Rd
- 4458 Brockland Dr
- 1575 Thompson Creek Rd
- 0 Thompson Creek Rd
- 358 Dover Rd
- 670 Jones Franklin Rd
- 1737 Pembrook Dr
- 1737 Pembrook Dr Unit 18
- 1732 Carroll Rd
- 1732 Pembrook Dr
- 1726 Carroll Rd
- 1749 Pembrook Dr
- 1726 Pembrook Dr
- 1720 Carroll Rd
- 1748 Pembrook Dr
- 1715 Pembrook Dr
- 1710 Carroll Rd
- 1767 Pembrook Dr
- 1743 Carroll Rd
- 1711 Pembrook Dr
- 1708 Pembrook Dr
- 1731 Carroll Rd
- 1768 Pembrook Dr
- 1757 Carroll Rd
- 1694 Carroll Rd
- 1775 Carroll Rd