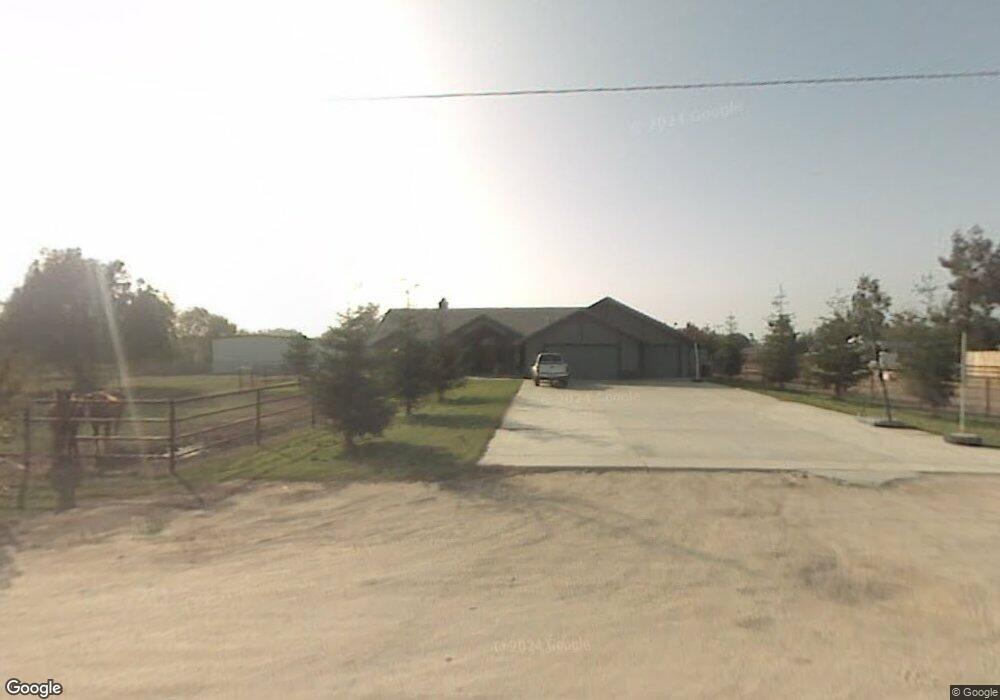
1731 Rodriguez Rd Bakersfield, CA 93314
Estimated Value: $681,000 - $872,000
4
Beds
2
Baths
2,938
Sq Ft
$265/Sq Ft
Est. Value
About This Home
This home is located at 1731 Rodriguez Rd, Bakersfield, CA 93314 and is currently estimated at $777,883, approximately $264 per square foot. 1731 Rodriguez Rd is a home located in Kern County with nearby schools including Rio Bravo-Greeley Elementary School, Rio Bravo Elementary School, and Liberty High School.
Ownership History
Date
Name
Owned For
Owner Type
Purchase Details
Closed on
Apr 22, 1998
Sold by
Rutledge Susan K
Bought by
Rutledge Joseph C
Current Estimated Value
Home Financials for this Owner
Home Financials are based on the most recent Mortgage that was taken out on this home.
Original Mortgage
$215,095
Outstanding Balance
$40,653
Interest Rate
7.05%
Estimated Equity
$737,230
Purchase Details
Closed on
Jan 3, 1997
Sold by
Kavanagh Robbin S
Bought by
Kavanagh William E
Purchase Details
Closed on
Jan 31, 1996
Sold by
Niewiara David Peter and Niewiara Colleen
Bought by
Kavanagh William E and Kavanagh Robbin S
Home Financials for this Owner
Home Financials are based on the most recent Mortgage that was taken out on this home.
Original Mortgage
$171,650
Interest Rate
7.05%
Create a Home Valuation Report for This Property
The Home Valuation Report is an in-depth analysis detailing your home's value as well as a comparison with similar homes in the area
Home Values in the Area
Average Home Value in this Area
Purchase History
| Date | Buyer | Sale Price | Title Company |
|---|---|---|---|
| Rutledge Joseph C | -- | Fidelity National Title Co | |
| Rutledge Joseph C | $235,000 | Fidelity National Title Co | |
| Kavanagh William E | -- | -- | |
| Kavanagh William E | $215,000 | Fidelity National Title |
Source: Public Records
Mortgage History
| Date | Status | Borrower | Loan Amount |
|---|---|---|---|
| Open | Rutledge Joseph C | $215,095 | |
| Previous Owner | Kavanagh William E | $171,650 |
Source: Public Records
Tax History
| Year | Tax Paid | Tax Assessment Tax Assessment Total Assessment is a certain percentage of the fair market value that is determined by local assessors to be the total taxable value of land and additions on the property. | Land | Improvement |
|---|---|---|---|---|
| 2025 | $5,713 | $439,182 | $103,774 | $335,408 |
| 2024 | $5,605 | $430,572 | $101,740 | $328,832 |
| 2023 | $5,605 | $422,132 | $99,746 | $322,386 |
| 2022 | $5,617 | $413,857 | $97,791 | $316,066 |
| 2021 | $5,490 | $405,744 | $95,874 | $309,870 |
| 2020 | $5,322 | $401,585 | $94,891 | $306,694 |
| 2019 | $5,209 | $401,585 | $94,891 | $306,694 |
| 2018 | $4,997 | $385,994 | $91,207 | $294,787 |
| 2017 | $4,933 | $378,427 | $89,419 | $289,008 |
| 2016 | $4,608 | $371,009 | $87,666 | $283,343 |
| 2015 | $4,463 | $365,438 | $86,350 | $279,088 |
| 2014 | $4,388 | $358,281 | $84,659 | $273,622 |
Source: Public Records
Map
Nearby Homes
- 16451 Barton Ln
- 16725 Weatherly Ct
- 16601 Keystone Place
- 16719 Keystone Place
- 16711 Keystone Place
- 13547 Philip Phelps Ave Ave
- 13601 Philip Phelps Ave Ave
- 15803 Screaming Eagle Ave
- 15918 Clos du Val Ave
- 15733 Joseph Phelps Ave
- 16016 Clarisse St
- 16515 Brimhall Rd
- 15708 Joseph Phelps Ave
- 8317 Littleton St
- 17340 Legend Oaks Ln
- 15709 Marty Ave
- 15801 Susan Eileen Ave Unit 1
- 17321 Falling Creek Ave
- 15520 Georges Letour Ave
- 17316 Brimhall Rd
- 16427 Palm Ave
- 16346 Dollie Mae Ct
- 1734 Angie Ct
- 16551 Palm Ave
- 16300 Dollie Mae Ct
- 1652 Angie Ct
- 1620 Rodriguez Rd
- 1631 Rodriguez Rd
- 16406 Palm Ave
- 16320 Palm Ave
- 16318 Tamatha Lynn Way
- 1640 Angie Ct
- 16226 Dollie Mae Ct
- 1651 Angie Ct
- 1747 Angie Ct
- 1540 Rodriguez Rd
- 16520 Palm Ave
- 16612 Palm Ave
- 16701 Palm Ave
- 16232 Palm Ave
Your Personal Tour Guide
Ask me questions while you tour the home.