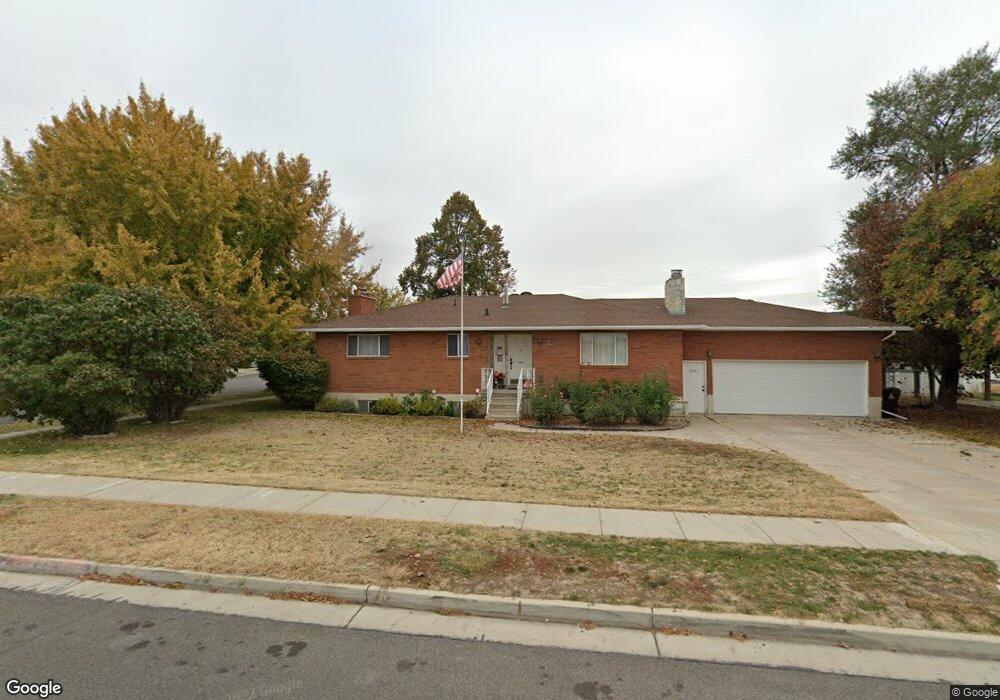
1731 W 700 S Syracuse, UT 84075
Estimated Value: $486,000 - $547,000
4
Beds
3
Baths
1,416
Sq Ft
$362/Sq Ft
Est. Value
About This Home
This home is located at 1731 W 700 S, Syracuse, UT 84075 and is currently estimated at $512,620, approximately $362 per square foot. 1731 W 700 S is a home located in Davis County with nearby schools including Cook School, Syracuse Junior High School, and Syracuse High School.
Ownership History
Date
Name
Owned For
Owner Type
Purchase Details
Closed on
Mar 16, 2022
Sold by
Holdeman Lynn W and Holdeman Joyce H
Bought by
Lynn And Joyce Holdeman Living Trust
Current Estimated Value
Purchase Details
Closed on
May 25, 2010
Sold by
Tmr Enterprises Ltd
Bought by
Holdeman Lynn W and Holdeman Joyce H
Home Financials for this Owner
Home Financials are based on the most recent Mortgage that was taken out on this home.
Original Mortgage
$159,000
Interest Rate
5.03%
Mortgage Type
New Conventional
Purchase Details
Closed on
Nov 20, 2001
Sold by
U S Development Inc
Bought by
Tmr Enterprises Ltd
Purchase Details
Closed on
Jan 10, 2001
Sold by
Tmr Enterprises Ltd
Bought by
U S Development Inc
Purchase Details
Closed on
Sep 27, 1999
Sold by
Ramsey Tom M and Ramsey Vida Mae
Bought by
Strahan Jeffery W and Strahan Carol J
Create a Home Valuation Report for This Property
The Home Valuation Report is an in-depth analysis detailing your home's value as well as a comparison with similar homes in the area
Home Values in the Area
Average Home Value in this Area
Purchase History
| Date | Buyer | Sale Price | Title Company |
|---|---|---|---|
| Lynn And Joyce Holdeman Living Trust | -- | None Listed On Document | |
| Holdeman Lynn W | -- | Mountain View Title | |
| Tmr Enterprises Ltd | -- | Bonneville Title Company Inc | |
| U S Development Inc | -- | Mountain View Title & Escrow | |
| Tmr Enterprises Ltd | -- | Mountain View Title & Escrow | |
| Strahan Jeffery W | -- | First American Title Ins Co |
Source: Public Records
Mortgage History
| Date | Status | Borrower | Loan Amount |
|---|---|---|---|
| Previous Owner | Holdeman Lynn W | $159,000 |
Source: Public Records
Tax History Compared to Growth
Tax History
| Year | Tax Paid | Tax Assessment Tax Assessment Total Assessment is a certain percentage of the fair market value that is determined by local assessors to be the total taxable value of land and additions on the property. | Land | Improvement |
|---|---|---|---|---|
| 2025 | $2,406 | $232,100 | $101,179 | $130,921 |
| 2024 | $2,310 | $224,401 | $89,997 | $134,404 |
| 2023 | $2,147 | $380,000 | $156,281 | $223,719 |
| 2022 | $2,347 | $227,700 | $88,848 | $138,852 |
| 2021 | $2,064 | $310,000 | $132,217 | $177,783 |
| 2020 | $1,809 | $263,000 | $111,172 | $151,828 |
| 2019 | $1,853 | $266,000 | $113,581 | $152,419 |
| 2018 | $1,705 | $243,000 | $107,028 | $135,972 |
| 2016 | $1,590 | $118,800 | $40,900 | $77,900 |
| 2015 | $1,731 | $123,200 | $40,900 | $82,300 |
| 2014 | $1,479 | $107,250 | $40,900 | $66,350 |
| 2013 | -- | $97,857 | $37,470 | $60,387 |
Source: Public Records
Map
Nearby Homes
- 916 S 1760 W
- 922 S 1760 W
- 587 S 1400 W
- 817 S 1350 W
- 1251 S 1650 W
- 2050 Craftsman Plan at Legacy Park - Collection
- 2200 Garden Plan at Legacy Park - Collection
- Lincoln Farmhouse Plan at Legacy Park - Estates
- Hamilton Traditional Plan at Legacy Park - Estates
- Tivoli Traditional Plan at Legacy Park - Estates
- Torino Farmhouse Plan at Legacy Park - Estates
- 2400 Farmhouse Plan at Legacy Park - Collection
- 1327 S 1650 W
- 1648 W 150 S
- 1828 W 75 S
- 135 S 1525 W
- 1097 W 850 S
- 2117 W 1275 S
- 1166 Dallas St
- 4284 W 350 S Unit 615