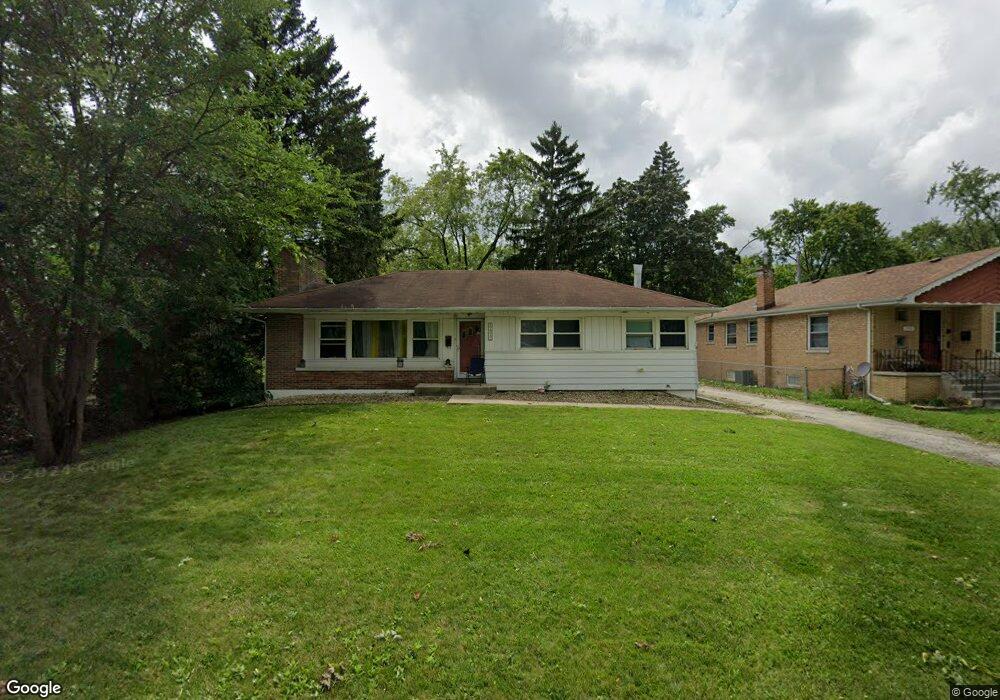
17312 Lowell Ave Hazel Crest, IL 60429
Estimated Value: $152,000 - $200,000
3
Beds
2
Baths
1,063
Sq Ft
$168/Sq Ft
Est. Value
About This Home
This home is located at 17312 Lowell Ave, Hazel Crest, IL 60429 and is currently estimated at $178,317, approximately $167 per square foot. 17312 Lowell Ave is a home located in Cook County with nearby schools including Mae Jemison School, Prairie-Hills Junior High School, and Hillcrest High School.
Ownership History
Date
Name
Owned For
Owner Type
Purchase Details
Closed on
Apr 10, 2018
Sold by
1Pbj Properties Llc
Bought by
A & R Rehab Llc
Current Estimated Value
Home Financials for this Owner
Home Financials are based on the most recent Mortgage that was taken out on this home.
Original Mortgage
$104,850
Interest Rate
4.4%
Mortgage Type
Commercial
Purchase Details
Closed on
May 12, 2009
Sold by
Deutsche Bank National Trust Company
Bought by
Ipbj Properties Llc
Purchase Details
Closed on
Jun 2, 2008
Sold by
Leonard Cherie L
Bought by
Deutsche Bank National Trust Co and New Century Home Equity Loan Tr 2004-3
Purchase Details
Closed on
Aug 20, 1999
Sold by
Mikulich Guy R and Mikulich Sandra L
Bought by
Leonard Cherie
Home Financials for this Owner
Home Financials are based on the most recent Mortgage that was taken out on this home.
Original Mortgage
$93,925
Interest Rate
7.7%
Mortgage Type
Balloon
Create a Home Valuation Report for This Property
The Home Valuation Report is an in-depth analysis detailing your home's value as well as a comparison with similar homes in the area
Home Values in the Area
Average Home Value in this Area
Purchase History
| Date | Buyer | Sale Price | Title Company |
|---|---|---|---|
| A & R Rehab Llc | $71,500 | Greater Illinois Title | |
| Ipbj Properties Llc | $60,000 | None Available | |
| Deutsche Bank National Trust Co | -- | None Available | |
| Leonard Cherie | -- | -- |
Source: Public Records
Mortgage History
| Date | Status | Borrower | Loan Amount |
|---|---|---|---|
| Closed | A & R Rehab Llc | $104,850 | |
| Previous Owner | Leonard Cherie | $93,925 |
Source: Public Records
Tax History Compared to Growth
Tax History
| Year | Tax Paid | Tax Assessment Tax Assessment Total Assessment is a certain percentage of the fair market value that is determined by local assessors to be the total taxable value of land and additions on the property. | Land | Improvement |
|---|---|---|---|---|
| 2024 | $5,903 | $11,523 | $2,068 | $9,455 |
| 2023 | $4,725 | $11,523 | $2,068 | $9,455 |
| 2022 | $4,725 | $6,437 | $1,750 | $4,687 |
| 2021 | $4,554 | $6,436 | $1,750 | $4,686 |
| 2020 | $4,323 | $6,436 | $1,750 | $4,686 |
| 2019 | $3,585 | $5,354 | $1,591 | $3,763 |
| 2018 | $4,635 | $7,144 | $1,591 | $5,553 |
| 2017 | $4,331 | $7,144 | $1,591 | $5,553 |
| 2016 | $3,609 | $6,173 | $1,431 | $4,742 |
| 2015 | $3,458 | $6,173 | $1,431 | $4,742 |
| 2014 | $3,372 | $6,173 | $1,431 | $4,742 |
| 2013 | $3,579 | $7,474 | $1,431 | $6,043 |
Source: Public Records
Map
Nearby Homes
- 2814 Lexington Dr
- 2818 Tennyson Place
- 2810 Lexington Dr
- 3003 Longfellow Ave
- 2900 175th St
- 2912 175th St
- 3004 Longfellow Ave
- 17410 Emerson Ave
- 3107 Longfellow Ave
- 17405 Longfellow Ave
- 7 E Carriageway Dr Unit 311
- 17504 Danielle Ct
- 5 E Carriageway Dr Unit 210
- 17107 Longfellow Ave
- 2722 Cherrywood Ln
- 17303 Kedzie Ave
- 17613 Grandview Dr
- 2711 Larkspur Ln
- 17622 Oakwood Dr
- 17107 California Ave
- 17312 Lowell Ave
- 17310 Lowell Ave
- 17400 Lowell Ave
- 17308 Lowell Ave
- 17402 Lowell Ave
- 17313 Holmes Ave
- 17309 Holmes Ave
- 17315 Holmes Ave
- 17307 Holmes Ave
- 17404 Lowell Ave
- 17315 Lowell Ave
- 17311 Lowell Ave
- 17319 Lowell Ave
- 2908 Lexington Dr
- 2910 Lexington Dr
- 2912 Lexington Dr
- 2902 Lexington Dr
- 17401 Lowell Ave
- 17309 Lowell Ave