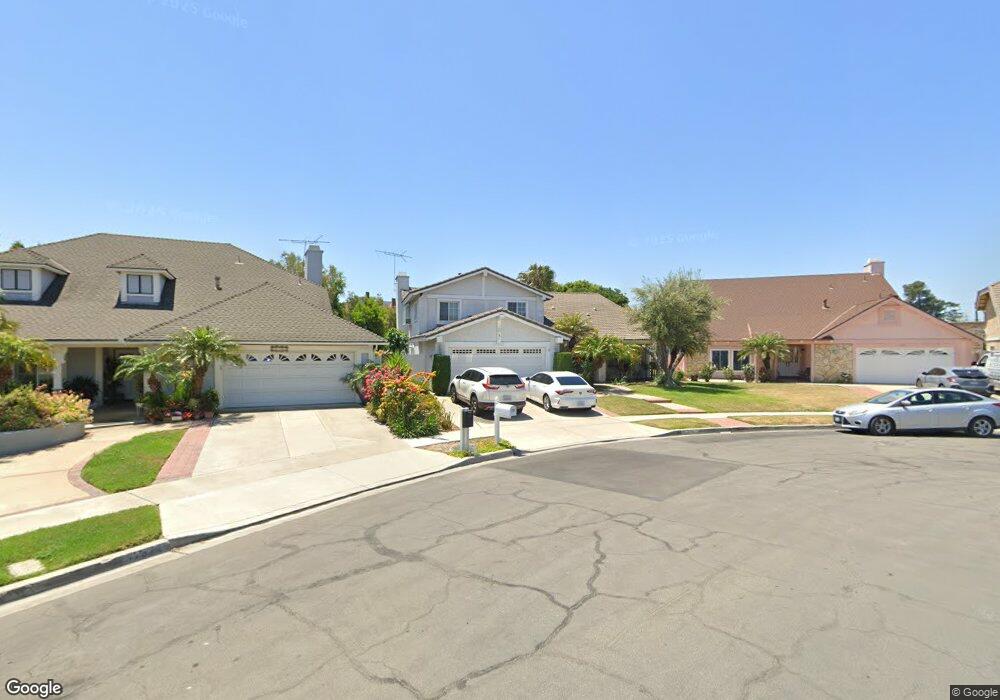
17312 Medford Ave Tustin, CA 92780
Estimated Value: $1,470,000 - $1,898,000
5
Beds
3
Baths
2,912
Sq Ft
$584/Sq Ft
Est. Value
About This Home
This home is located at 17312 Medford Ave, Tustin, CA 92780 and is currently estimated at $1,699,869, approximately $583 per square foot. 17312 Medford Ave is a home located in Orange County with nearby schools including Loma Vista Elementary School, Hewes Middle School, and Foothill High School.
Ownership History
Date
Name
Owned For
Owner Type
Purchase Details
Closed on
Oct 22, 2013
Sold by
Vizcarra Robert and Vizcarra Susana
Bought by
Vizcarra Robert and Vizcarra Susana A
Current Estimated Value
Purchase Details
Closed on
Sep 19, 2001
Sold by
Schuster Mary Sue
Bought by
Vizcarra Robert and Vizcarra Susana
Home Financials for this Owner
Home Financials are based on the most recent Mortgage that was taken out on this home.
Original Mortgage
$437,500
Outstanding Balance
$168,736
Interest Rate
6.84%
Mortgage Type
Stand Alone First
Estimated Equity
$1,531,133
Purchase Details
Closed on
Jul 7, 1997
Sold by
Schuster Stephen L Trust and Sue Mary Sue
Bought by
Schuster Mary Sue
Purchase Details
Closed on
Jun 30, 1997
Sold by
Stephen L Schuster Trust and Sue Mary Sue
Bought by
Schuster Mary Sue
Purchase Details
Closed on
Jun 18, 1997
Sold by
Schuster Stephen L and Lasalle Stephen Lasalle
Bought by
Schuster Mary Sue and The Stephen L Schuster Trust
Create a Home Valuation Report for This Property
The Home Valuation Report is an in-depth analysis detailing your home's value as well as a comparison with similar homes in the area
Home Values in the Area
Average Home Value in this Area
Purchase History
| Date | Buyer | Sale Price | Title Company |
|---|---|---|---|
| Vizcarra Robert | -- | None Available | |
| Vizcarra Robert | $440,000 | American Title Co | |
| Schuster Mary Sue | -- | -- | |
| Schuster Mary Sue | -- | Fidelity National Title | |
| Schuster Mary Sue | -- | -- |
Source: Public Records
Mortgage History
| Date | Status | Borrower | Loan Amount |
|---|---|---|---|
| Open | Vizcarra Robert | $437,500 |
Source: Public Records
Tax History Compared to Growth
Tax History
| Year | Tax Paid | Tax Assessment Tax Assessment Total Assessment is a certain percentage of the fair market value that is determined by local assessors to be the total taxable value of land and additions on the property. | Land | Improvement |
|---|---|---|---|---|
| 2025 | $7,359 | $661,717 | $389,569 | $272,148 |
| 2024 | $7,359 | $648,743 | $381,931 | $266,812 |
| 2023 | $7,180 | $636,023 | $374,442 | $261,581 |
| 2022 | $7,072 | $623,552 | $367,100 | $256,452 |
| 2021 | $6,929 | $611,326 | $359,902 | $251,424 |
| 2020 | $6,893 | $605,058 | $356,212 | $248,846 |
| 2019 | $6,723 | $593,195 | $349,228 | $243,967 |
| 2018 | $6,612 | $581,564 | $342,380 | $239,184 |
| 2017 | $6,496 | $570,161 | $335,666 | $234,495 |
| 2016 | $6,379 | $558,982 | $329,084 | $229,898 |
| 2015 | $6,432 | $550,586 | $324,141 | $226,445 |
| 2014 | $6,266 | $539,801 | $317,791 | $222,010 |
Source: Public Records
Map
Nearby Homes
- 13822 Deodar St
- 13762 Palace Way
- 17562 Laurie Ln
- 13702 Loretta Dr
- 17522 Vandenberg Ln Unit 3
- 2411 Deodar St Unit 2
- 2014 E 20th St
- 13441 Laurinda Way
- 2123 Barclay Ct
- 1919 Sherry Ln Unit 46
- 1919 Sherry Ln Unit 31
- 14291 Prospect Ave
- 17771 Orange Tree Ln
- 1830 E 19th St Unit 3
- 1345 Cabrillo Park Dr Unit R02
- 1345 Cabrillo Park Dr Unit L16
- 1345 Cabrillo Park Dr Unit B02
- 1345 Cabrillo Park Dr Unit E01
- 2514 N Tustin Ave Unit 71
- 1345 Cabrillo Unit J11
- 13841 Marshall Ln
- 17322 Medford Ave
- 13831 Marshall Ln
- 17332 Medford Ave
- 13821 Marshall Ln
- 17321 Medford Ave
- 13951 Carroll Way
- 17342 Medford Ave
- 13811 Marshall Ln
- 17331 Medford Ave
- 17322 Anglin Ln
- 13801 Marshall Ln
- 17341 Medford Ave
- 17332 Anglin Ln
- 13791 Marshall Ln
- 17342 Anglin Ln
- 13811 Fairmont Way
- 13831 Fairmont Way
- 13781 Marshall Ln
- 17321 Anglin Ln