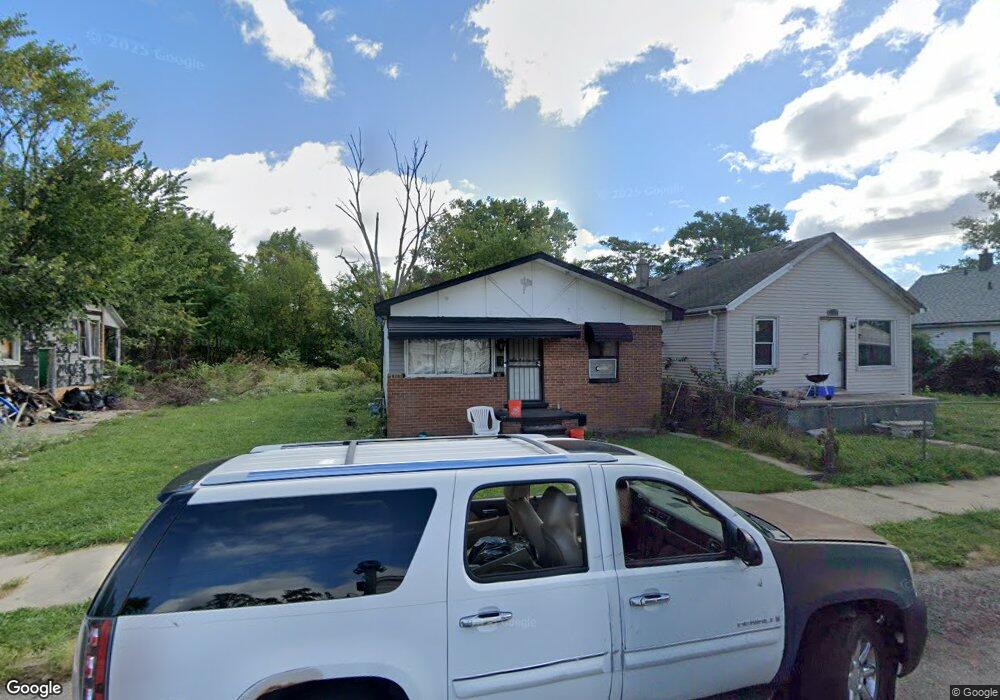
17314 Charest St Detroit, MI 48212
Cadillac Heights NeighborhoodEstimated Value: $48,283 - $75,000
3
Beds
1
Bath
928
Sq Ft
$71/Sq Ft
Est. Value
About This Home
This home is located at 17314 Charest St, Detroit, MI 48212 and is currently estimated at $66,321, approximately $71 per square foot. 17314 Charest St is a home located in Wayne County with nearby schools including Nolan Elementary/Middle School, Charles L. Spain Elementary-Middle School, and Edward 'Duke' Ellington Conservatory of Music and Art.
Ownership History
Date
Name
Owned For
Owner Type
Purchase Details
Closed on
Jul 3, 2024
Sold by
Gilbert-White Tracey L
Bought by
Gilbert-White Tracey L
Current Estimated Value
Purchase Details
Closed on
Jun 20, 2024
Sold by
White Andre Louis
Bought by
Gilbert-White Tracey L
Purchase Details
Closed on
May 28, 2024
Sold by
White Andre Louis
Bought by
Gilbert-White Tracey L
Purchase Details
Closed on
Feb 1, 2021
Sold by
Pearson Eugene B
Bought by
White Andre
Purchase Details
Closed on
Jan 23, 2012
Sold by
United Community Housing Coalition
Bought by
Pearson Eugene B
Purchase Details
Closed on
Nov 22, 2011
Sold by
Wayne County Treasurer
Bought by
United Community Housing Coalition
Purchase Details
Closed on
Sep 1, 2005
Sold by
Anderson Kenneth D
Bought by
Pearson Eugene B
Purchase Details
Closed on
Dec 30, 2003
Sold by
First Union National Bank
Bought by
Anderson Kenneth D
Create a Home Valuation Report for This Property
The Home Valuation Report is an in-depth analysis detailing your home's value as well as a comparison with similar homes in the area
Home Values in the Area
Average Home Value in this Area
Purchase History
| Date | Buyer | Sale Price | Title Company |
|---|---|---|---|
| Gilbert-White Tracey L | -- | None Listed On Document | |
| Gilbert-White Tracey L | -- | None Listed On Document | |
| Gilbert-White Tracey L | -- | None Listed On Document | |
| White Andre | $5,000 | None Available | |
| Pearson Eugene B | -- | None Available | |
| United Community Housing Coalition | $500 | None Available | |
| Pearson Eugene B | $75,000 | Able Title Agency Llc | |
| Anderson Kenneth D | $26,500 | Commonwealth Land Title |
Source: Public Records
Tax History
| Year | Tax Paid | Tax Assessment Tax Assessment Total Assessment is a certain percentage of the fair market value that is determined by local assessors to be the total taxable value of land and additions on the property. | Land | Improvement |
|---|---|---|---|---|
| 2025 | $770 | $9,400 | $0 | $0 |
| 2024 | $756 | $8,000 | $0 | $0 |
| 2023 | $623 | $6,400 | $0 | $0 |
| 2022 | $710 | $6,700 | $0 | $0 |
| 2021 | $791 | $5,000 | $0 | $0 |
| 2020 | $739 | $6,300 | $0 | $0 |
| 2019 | $629 | $5,760 | $0 | $0 |
| 2018 | $558 | $5,600 | $0 | $0 |
| 2017 | $100 | $5,300 | $0 | $0 |
| 2016 | $877 | $23,200 | $0 | $0 |
| 2015 | $1,002 | $10,600 | $0 | $0 |
| 2013 | $971 | $13,263 | $0 | $0 |
| 2010 | -- | $19,445 | $595 | $18,850 |
Source: Public Records
Map
Nearby Homes
- 17809 Mcdougall St
- 17809 Binder St
- 18010 Anglin St
- 13826 Gallagher St
- 17520 Goddard St
- 17403 Goddard St
- 17922 Arlington St
- 18423 Norwood St
- 13946 Arlington St
- 13486 Gallagher St
- 17957 Goddard St
- 18540 Anglin St
- 18591 Brinker St
- 18128 Fleming St
- 18660 Charest St
- 13479 Mackay St
- 18660 Klinger St
- 18620 Maine St
- 17144 Justine St
- 17138 Marx St
- 17318 Charest St
- 17310 Charest St
- 17328 Charest St
- 17302 Charest St
- 17298 Charest St
- 17321 Gallagher St
- 17315 Gallagher St
- 17305 Gallagher St
- 17290 Charest St
- 17327 Gallagher St
- 17333 Gallagher St
- 17321 Charest St
- 17315 Charest St
- 17331 Charest St
- 17309 Charest St
- 17339 Gallagher St
- 17337 Charest St
- 17345 Gallagher St
- 17345 Charest St
- 17297 Charest St
Your Personal Tour Guide
Ask me questions while you tour the home.