Estimated Value: $609,000 - $638,000
5
Beds
4
Baths
3,640
Sq Ft
$171/Sq Ft
Est. Value
About This Home
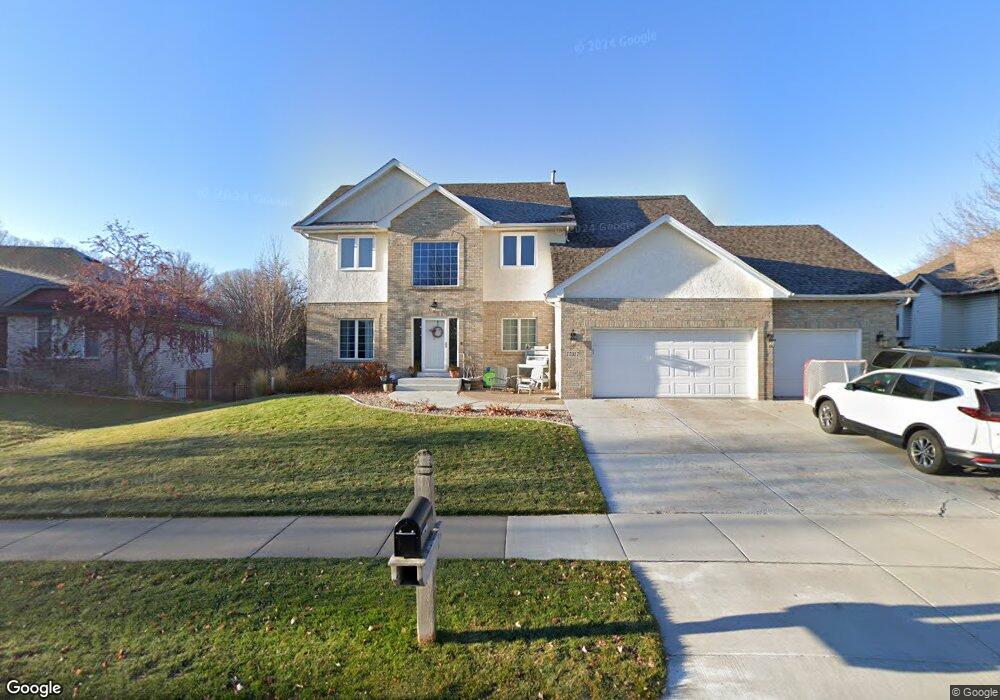
This home is located at 17317 79th Place N, Osseo, MN 55311 and is currently estimated at $623,513, approximately $171 per square foot. 17317 79th Place N is a home located in Hennepin County with nearby schools including Rush Creek Elementary School, Maple Grove Middle School, and Maple Grove Senior High School.
Ownership History
Date
Name
Owned For
Owner Type
Purchase Details
Closed on
Feb 2, 2022
Sold by
Fjosne Christopher M and Fjosne Melinda M
Bought by
Fjosne Christopher M and Fjosne Melinda M
Current Estimated Value
Purchase Details
Closed on
Dec 31, 2019
Sold by
Paquette Justin and Scherweit Kristi
Bought by
Fjosne Christopher M and Fjosne Melinda M
Home Financials for this Owner
Home Financials are based on the most recent Mortgage that was taken out on this home.
Original Mortgage
$345,000
Interest Rate
3.6%
Mortgage Type
New Conventional
Purchase Details
Closed on
Jun 30, 2011
Sold by
Whetston Craig A and Whetston Catherine A
Bought by
Paquette Justin and Scherweit Kristi
Home Financials for this Owner
Home Financials are based on the most recent Mortgage that was taken out on this home.
Original Mortgage
$319,500
Interest Rate
4.63%
Mortgage Type
New Conventional
Purchase Details
Closed on
Aug 25, 1998
Sold by
Jms Development Corp
Bought by
Kresal Custom Homes
Create a Home Valuation Report for This Property
The Home Valuation Report is an in-depth analysis detailing your home's value as well as a comparison with similar homes in the area
Home Values in the Area
Average Home Value in this Area
Purchase History
| Date | Buyer | Sale Price | Title Company |
|---|---|---|---|
| Fjosne Christopher M | -- | None Listed On Document | |
| Fjosne Christopher M | $475,000 | Results Title | |
| Paquette Justin | $355,000 | Signature Title Midwest Serv | |
| Paquette Justin | $355,000 | -- | |
| Kresal Custom Homes | $189,400 | -- |
Source: Public Records
Mortgage History
| Date | Status | Borrower | Loan Amount |
|---|---|---|---|
| Previous Owner | Fjosne Christopher M | $345,000 | |
| Previous Owner | Paquette Justin | $319,500 |
Source: Public Records
Tax History Compared to Growth
Tax History
| Year | Tax Paid | Tax Assessment Tax Assessment Total Assessment is a certain percentage of the fair market value that is determined by local assessors to be the total taxable value of land and additions on the property. | Land | Improvement |
|---|---|---|---|---|
| 2024 | $7,489 | $562,000 | $128,000 | $434,000 |
| 2023 | $7,584 | $586,700 | $145,300 | $441,400 |
| 2022 | $6,285 | $564,000 | $111,000 | $453,000 |
| 2021 | $5,255 | $476,400 | $93,500 | $382,900 |
| 2020 | $5,633 | $425,800 | $57,700 | $368,100 |
| 2019 | $5,845 | $433,400 | $75,900 | $357,500 |
| 2018 | $6,041 | $424,400 | $79,200 | $345,200 |
| 2017 | $5,937 | $405,900 | $87,000 | $318,900 |
| 2016 | $5,945 | $401,100 | $87,000 | $314,100 |
| 2015 | $5,726 | $377,600 | $102,000 | $275,600 |
| 2014 | -- | $341,900 | $95,000 | $246,900 |
Source: Public Records
Map
Nearby Homes
- 16997 78th Place N
- 16878 79th Place N
- 8048 Narcissus Ln N
- 16824 79th Ave N
- 17005 78th Ct N
- 7722 Everest Ln N
- 7788 Everest Ct N
- 7547 Inland Ln N
- 7731 Queensland Ln N
- 7461 Merrimac Ln N
- 7200 Comstock Ln N
- 7585 Blackoaks Ln N
- 16917 73rd Place N
- 8347 Zanzibar Ct N
- 7201 Jewel Ln N Unit 907
- 16955 Weaver Lake Dr
- 17344 72nd Ave N Unit 1304
- 7225 Everest Ln N
- 16586 73rd Ave N
- 17095 72nd Ave N Unit 4301
- 17305 79th Place N
- 17329 79th Place N
- 17351 79th Place N
- 17293 79th Place N
- 17316 79th Place N
- 17383 79th Place N
- 17284 79th Place N
- 7918 Kimberly Ln N
- 17340 79th Place N
- 17281 79th Place N
- 17252 79th Place N
- 17298 79th Ct N
- 17275 79th Ct N
- 17352 79th Place N
- 17259 79th Place N
- 17259 79th Place N
- 678X Kimberly Ln N
- 17374 79th Place N
- 7900 Lawndale Ln N
- 17447 79th Place N