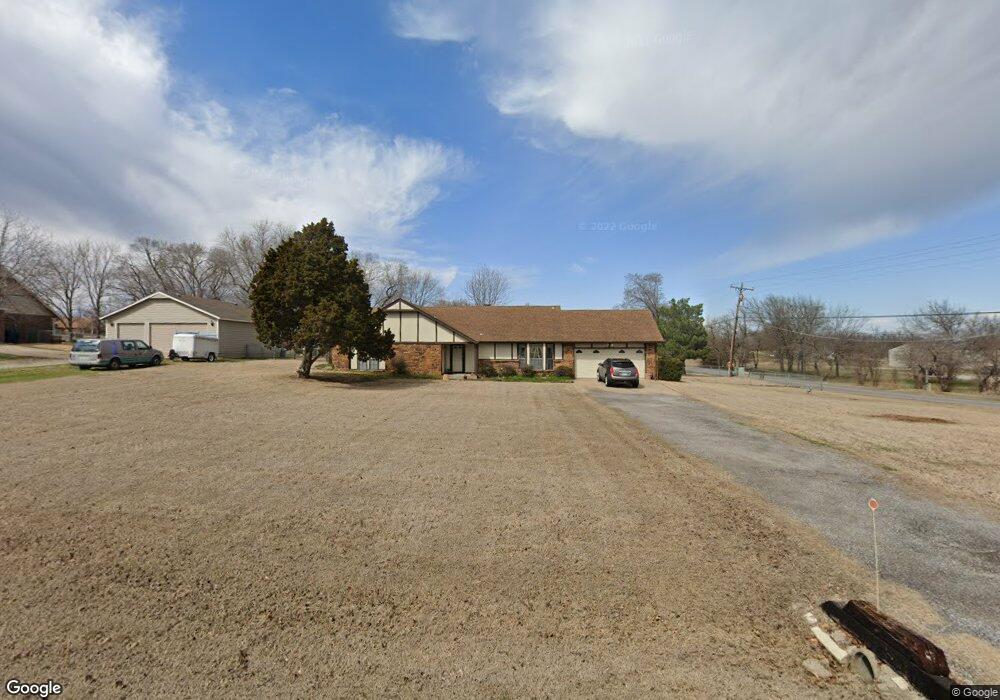
17317 E 109th St N Owasso, OK 74055
Estimated Value: $282,005 - $339,000
3
Beds
2
Baths
1,530
Sq Ft
$196/Sq Ft
Est. Value
About This Home
This home is located at 17317 E 109th St N, Owasso, OK 74055 and is currently estimated at $300,501, approximately $196 per square foot. 17317 E 109th St N is a home located in Rogers County with nearby schools including Northeast Elementary School, Owasso 6th Grade Center, and Owasso 8th Grade Center.
Ownership History
Date
Name
Owned For
Owner Type
Purchase Details
Closed on
Oct 7, 2025
Sold by
Wood Daniel
Bought by
Wood Daniel and Richardville Theron S
Current Estimated Value
Purchase Details
Closed on
Dec 5, 2023
Sold by
City Of Claremore
Bought by
Wood Barbara E
Purchase Details
Closed on
Jan 21, 2022
Sold by
Wood and Barbara
Bought by
Richardville Theron S
Purchase Details
Closed on
Oct 15, 2018
Sold by
Ysbrand Thomas J and Ysbrand Clarissa M
Bought by
Ysbrand Thomas J and Ysbrand Clarissa M
Purchase Details
Closed on
May 6, 2011
Sold by
Buss Everest Robert and Buss Brenda Carole
Bought by
Wood Daniel and Wood Barbara
Purchase Details
Closed on
Jun 26, 2009
Sold by
Lang Rita A
Bought by
Lang Rita A and Coombes John
Purchase Details
Closed on
Jul 25, 2006
Sold by
Buss Everett R and Buss Brenda C
Bought by
Buss Everett Robert and Buss Brenda Carole
Purchase Details
Closed on
Jun 29, 2005
Sold by
Ketter Thomas and Ketter Deborah J
Bought by
Ketter Thomas L and Ketter Deborah J
Purchase Details
Closed on
May 6, 1998
Sold by
Dahl Steven Leigh
Purchase Details
Closed on
Mar 19, 1993
Sold by
Bourgeois Brian J
Create a Home Valuation Report for This Property
The Home Valuation Report is an in-depth analysis detailing your home's value as well as a comparison with similar homes in the area
Home Values in the Area
Average Home Value in this Area
Purchase History
| Date | Buyer | Sale Price | Title Company |
|---|---|---|---|
| Wood Daniel | -- | None Listed On Document | |
| Wood Barbara E | $500 | None Listed On Document | |
| Richardville Theron S | -- | None Listed On Document | |
| Ysbrand Thomas J | -- | None Available | |
| Wood Daniel | $130,000 | None Available | |
| Lang Rita A | -- | None Available | |
| Buss Everett Robert | -- | None Available | |
| Ketter Thomas L | -- | None Available | |
| -- | $99,500 | -- | |
| -- | $84,900 | -- |
Source: Public Records
Tax History
| Year | Tax Paid | Tax Assessment Tax Assessment Total Assessment is a certain percentage of the fair market value that is determined by local assessors to be the total taxable value of land and additions on the property. | Land | Improvement |
|---|---|---|---|---|
| 2025 | $1,936 | $20,759 | $4,035 | $16,724 |
| 2024 | $1,840 | $20,155 | $3,918 | $16,237 |
| 2023 | $1,840 | $19,568 | $3,537 | $16,031 |
| 2022 | $1,763 | $18,998 | $3,055 | $15,943 |
| 2021 | $1,688 | $18,998 | $3,186 | $15,812 |
| 2020 | $1,633 | $17,908 | $2,750 | $15,158 |
| 2019 | $1,590 | $17,444 | $2,750 | $14,694 |
| 2018 | $1,579 | $17,967 | $2,750 | $15,217 |
| 2017 | $1,567 | $17,655 | $2,750 | $14,905 |
| 2016 | $1,520 | $17,141 | $2,750 | $14,391 |
| 2015 | $1,497 | $16,642 | $2,750 | $13,892 |
| 2014 | $1,451 | $16,157 | $2,750 | $13,407 |
Source: Public Records
Map
Nearby Homes
- 0 E 106th St N Unit 2543814
- 0 E 106th St N Unit 2546711
- 16629 E 115th St N
- 18818 E Bridgewater Place
- 0 N 193rd East Ave Unit 2609599
- 15907 E 106th Place N
- 11180 N 160th East Ave
- 16321 E 101st St N
- 15903 E 106th Place N
- 16315 E 101st St N
- 10611 N 159th East Ave
- 18509 E 100th St N
- 16550 E 120th St N
- 19000 E Knightsbridge Rd
- 10200 N 162nd East Ave
- 7410 N 159th East Ave
- 15810 E 106th St N
- 11840 N 190th East Ave
- 11890 S 4050 Rd
- 17916 E 96th St N
- 17315 E 109th St N
- 17318 E 109th St N
- 17316 E 109th St N
- 17313 E 109th St N
- 17701 E 108th St N
- 17309 E 109th St N
- 10807 N 177th East Ave
- 17314 E 109th St N
- 17316 E 110th St N
- 17314 E 110th St N
- 00 E 108th St N
- 10919 N 177th East Ave
- 17508 E 110th St N
- 17504 E 110th St N
- 17307 E 109th St N
- 10808 N 177th East Ave
- 10808 N 177th East Ave
- 17312 E 110th St N
- 17308 E 109th St N
- 17611 E 107th Place N
Your Personal Tour Guide
Ask me questions while you tour the home.