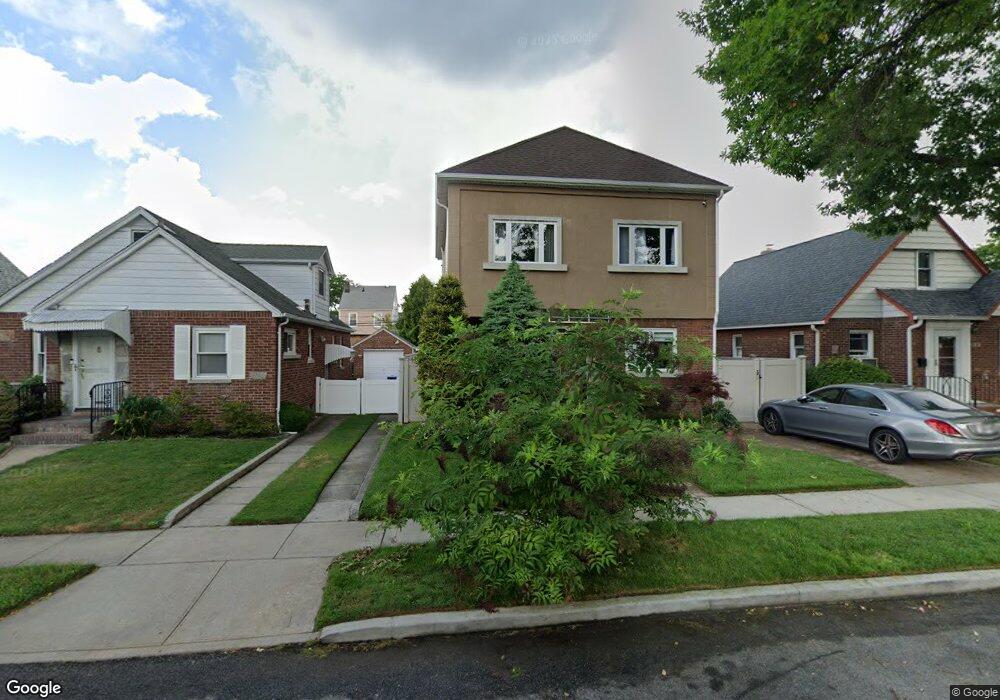
17319 47th Ave Flushing, NY 11358
Auburndale NeighborhoodEstimated Value: $1,137,510 - $1,344,000
Studio
--
Bath
1,956
Sq Ft
$616/Sq Ft
Est. Value
About This Home
This home is located at 17319 47th Ave, Flushing, NY 11358 and is currently estimated at $1,205,628, approximately $616 per square foot. 17319 47th Ave is a home located in Queens County with nearby schools including P.S. 107 Thomas A Dooley, George J. Ryan Middle School 216, and Francis Lewis High School.
Ownership History
Date
Name
Owned For
Owner Type
Purchase Details
Closed on
Dec 6, 2011
Sold by
Wanesian Hagop
Bought by
Dardac Stelica and Dardac Tina
Current Estimated Value
Home Financials for this Owner
Home Financials are based on the most recent Mortgage that was taken out on this home.
Original Mortgage
$409,500
Outstanding Balance
$277,809
Interest Rate
3.99%
Mortgage Type
Purchase Money Mortgage
Estimated Equity
$927,819
Purchase Details
Closed on
Jan 18, 2007
Sold by
The Louise Cetrola Trust
Bought by
Wanesian Hagop
Home Financials for this Owner
Home Financials are based on the most recent Mortgage that was taken out on this home.
Original Mortgage
$133,750
Interest Rate
6.16%
Purchase Details
Closed on
May 13, 2006
Sold by
Veitinger Ann
Bought by
Cetrola Trust Louise and Cetrola Trustee Louise
Purchase Details
Closed on
Apr 5, 1995
Sold by
Cetrola Anthony and Cetrola Louise
Bought by
Veitinger Ann
Create a Home Valuation Report for This Property
The Home Valuation Report is an in-depth analysis detailing your home's value as well as a comparison with similar homes in the area
Home Values in the Area
Average Home Value in this Area
Purchase History
| Date | Buyer | Sale Price | Title Company |
|---|---|---|---|
| Dardac Stelica | $585,000 | -- | |
| Dardac Stelica | $585,000 | -- | |
| Wanesian Hagop | $535,000 | -- | |
| Wanesian Hagop | $535,000 | -- | |
| Cetrola Trust Louise | -- | -- | |
| Cetrola Trust Louise | -- | -- | |
| Veitinger Ann | $50,000 | First American Title Ins Co | |
| Veitinger Ann | $50,000 | First American Title Ins Co |
Source: Public Records
Mortgage History
| Date | Status | Borrower | Loan Amount |
|---|---|---|---|
| Open | Dardac Stelica | $409,500 | |
| Closed | Dardac Stelica | $409,500 | |
| Previous Owner | Wanesian Hagop | $133,750 | |
| Previous Owner | Wanesian Hagop | $401,250 |
Source: Public Records
Tax History
| Year | Tax Paid | Tax Assessment Tax Assessment Total Assessment is a certain percentage of the fair market value that is determined by local assessors to be the total taxable value of land and additions on the property. | Land | Improvement |
|---|---|---|---|---|
| 2025 | $10,412 | $54,948 | $17,510 | $37,438 |
| 2024 | $10,412 | $51,838 | $15,664 | $36,174 |
| 2023 | $9,823 | $48,905 | $13,685 | $35,220 |
| 2022 | $9,211 | $62,700 | $19,980 | $42,720 |
| 2021 | $9,710 | $66,300 | $19,980 | $46,320 |
| 2020 | $9,692 | $60,780 | $19,980 | $40,800 |
| 2019 | $9,037 | $56,760 | $19,980 | $36,780 |
| 2018 | $8,308 | $40,754 | $15,029 | $25,725 |
| 2017 | $7,838 | $38,448 | $14,321 | $24,127 |
| 2016 | $7,686 | $38,448 | $14,321 | $24,127 |
| 2015 | $4,375 | $38,158 | $17,962 | $20,196 |
| 2014 | $4,375 | $35,999 | $18,760 | $17,239 |
Source: Public Records
Map
Nearby Homes
- 171-06 Bagley Ave
- 48-05 186th St
- 47-18 190th St
- 45-32 Utopia Pkwy
- 17528 Underhill Ave
- 19005 48th Ave
- 4818 190th St
- 4719 192nd St
- 4564 170th St
- 4953 Fresh Meadow Ln
- 4940 169th St
- 4539 192nd St
- 47-04 167th St
- 47-55 194th St
- 47-49 194th St
- 45-47 193rd St
- 45-25 168th St
- 49-75 175th Place
- 4604 195th St
- 4920 167th St
- 17315 47th Ave
- 17323 47th Ave
- 17315 47th Ave
- 17311 47th Ave
- 17327 47th Ave
- 17122 Courtney Ave
- 17118 Courtney Ave
- 171-24 Courtney Ave
- 17116 Courtney Ave
- 17124 Courtney Ave
- 17331 47th Ave
- 17307 47th Ave
- 17112 Courtney Ave
- 17128 Courtney Ave
- 171-16 Courtney Ave
- 171-28 Courtney Ave
- 17110 Courtney Ave
- 17324 47th Ave
- 173-24 47th Ave
- 17130 Courtney Ave
Your Personal Tour Guide
Ask me questions while you tour the home.