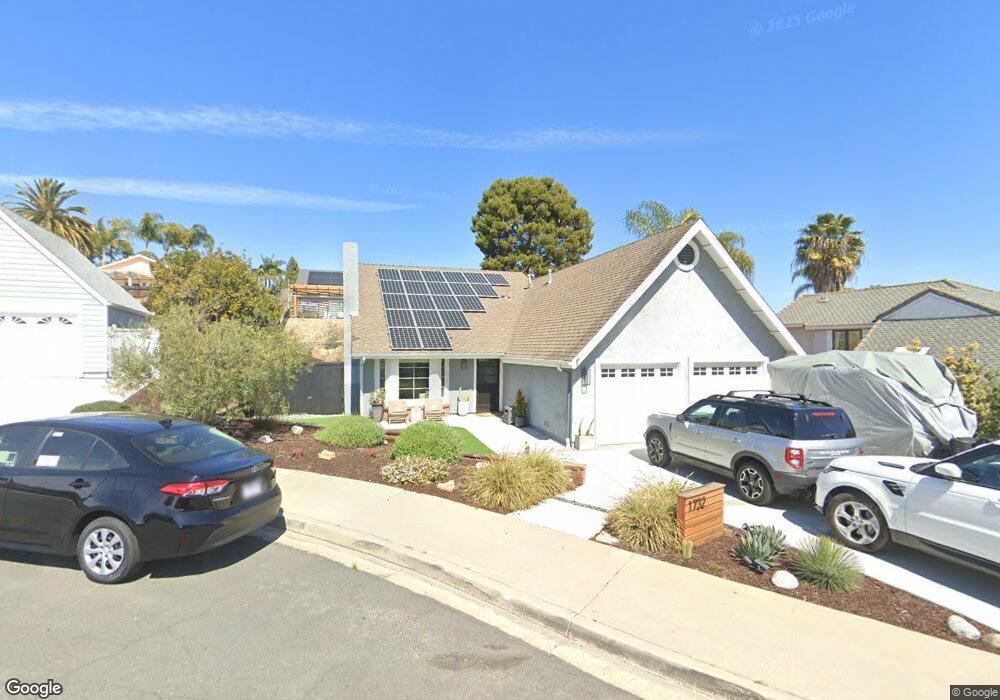
1732 Cereus Ct Carlsbad, CA 92011
La Costa NeighborhoodEstimated Value: $1,503,351 - $1,695,000
3
Beds
2
Baths
1,809
Sq Ft
$891/Sq Ft
Est. Value
About This Home
This home is located at 1732 Cereus Ct, Carlsbad, CA 92011 and is currently estimated at $1,611,338, approximately $890 per square foot. 1732 Cereus Ct is a home located in San Diego County with nearby schools including Aviara Oaks Elementary, Aviara Oaks Middle, and Sage Creek High.
Ownership History
Date
Name
Owned For
Owner Type
Purchase Details
Closed on
Aug 20, 2025
Sold by
Neville Gregory J and Neville Alexis S
Bought by
Gregory And Alexis Neville Family Trust and Neville
Current Estimated Value
Purchase Details
Closed on
Aug 6, 2010
Sold by
Clark Jeff and Clark Jennifer
Bought by
Neville Gregory J and Neville Alexis Strongwater
Home Financials for this Owner
Home Financials are based on the most recent Mortgage that was taken out on this home.
Original Mortgage
$529,200
Interest Rate
4.52%
Mortgage Type
New Conventional
Purchase Details
Closed on
Mar 24, 2004
Sold by
Davidovich Paul John and Davidovich Maureen E
Bought by
Clark Jeff and Clark Jennifer
Home Financials for this Owner
Home Financials are based on the most recent Mortgage that was taken out on this home.
Original Mortgage
$397,800
Interest Rate
4.87%
Mortgage Type
Negative Amortization
Purchase Details
Closed on
Nov 7, 1984
Create a Home Valuation Report for This Property
The Home Valuation Report is an in-depth analysis detailing your home's value as well as a comparison with similar homes in the area
Home Values in the Area
Average Home Value in this Area
Purchase History
| Date | Buyer | Sale Price | Title Company |
|---|---|---|---|
| Gregory And Alexis Neville Family Trust | -- | None Listed On Document | |
| Neville Gregory J | -- | None Listed On Document | |
| Neville Gregory J | $588,000 | Chicago Title Co | |
| Clark Jeff | $612,000 | Chicago Title Co | |
| -- | $127,500 | -- |
Source: Public Records
Mortgage History
| Date | Status | Borrower | Loan Amount |
|---|---|---|---|
| Previous Owner | Neville Gregory J | $529,200 | |
| Previous Owner | Clark Jeff | $397,800 |
Source: Public Records
Tax History Compared to Growth
Tax History
| Year | Tax Paid | Tax Assessment Tax Assessment Total Assessment is a certain percentage of the fair market value that is determined by local assessors to be the total taxable value of land and additions on the property. | Land | Improvement |
|---|---|---|---|---|
| 2025 | $7,877 | $753,317 | $515,873 | $237,444 |
| 2024 | $7,877 | $738,547 | $505,758 | $232,789 |
| 2023 | $7,835 | $724,067 | $495,842 | $228,225 |
| 2022 | $7,714 | $709,870 | $486,120 | $223,750 |
| 2021 | $7,655 | $695,952 | $476,589 | $219,363 |
| 2020 | $7,603 | $688,817 | $471,703 | $217,114 |
| 2019 | $7,465 | $675,311 | $462,454 | $212,857 |
| 2018 | $7,150 | $662,071 | $453,387 | $208,684 |
| 2017 | $90 | $649,091 | $444,498 | $204,593 |
| 2016 | $6,748 | $636,365 | $435,783 | $200,582 |
| 2015 | $6,720 | $626,808 | $429,238 | $197,570 |
| 2014 | $6,607 | $614,530 | $420,830 | $193,700 |
Source: Public Records
Map
Nearby Homes
- 7012 Goldenrod Way
- 7115 Manzanita St
- 7022 Ibis Place
- 7212 Columbine Dr
- 1933 Alga Rd Unit C
- 1913 Alga Rd Unit A
- 25 El Camino Real
- 7019 Estrella de Mar Rd
- 7234 Estrella de Mar Rd
- 1845 Cliff Swallow Ln
- 7021 Estrella de Mar Rd
- 7026 Estrella de Mar Rd
- 6907 Quail Place Unit F
- 6903 Quail Place
- 6911 Quail Place Unit C
- 6901 Tourmaline Place
- 1738 Oriole Ct
- 7310 Estrella de Mar Rd Unit 6
- 7323 Estrella de Mar Rd Unit 36
- 7323 Estrella de Mar Rd Unit 47
- 1734 Cereus Ct
- 1730 Cereus Ct
- 1736 Cereus Ct
- 7027 Columbine Dr
- 7029 Columbine Dr
- 7025 Columbine Dr
- 7031 Columbine Dr
- 1738 Cereus Ct
- 1728 Cereus Ct
- 1729 Cereus Ct
- 1731 Cereus Ct
- 1733 Cereus Ct
- 1727 Cereus Ct
- 7033 Columbine Dr
- 1735 Cereus Ct
- 1740 Cereus Ct
- 7102 Mimosa Dr
- 7100 Mimosa Dr
- 7104 Mimosa Dr
- 1737 Cereus Ct