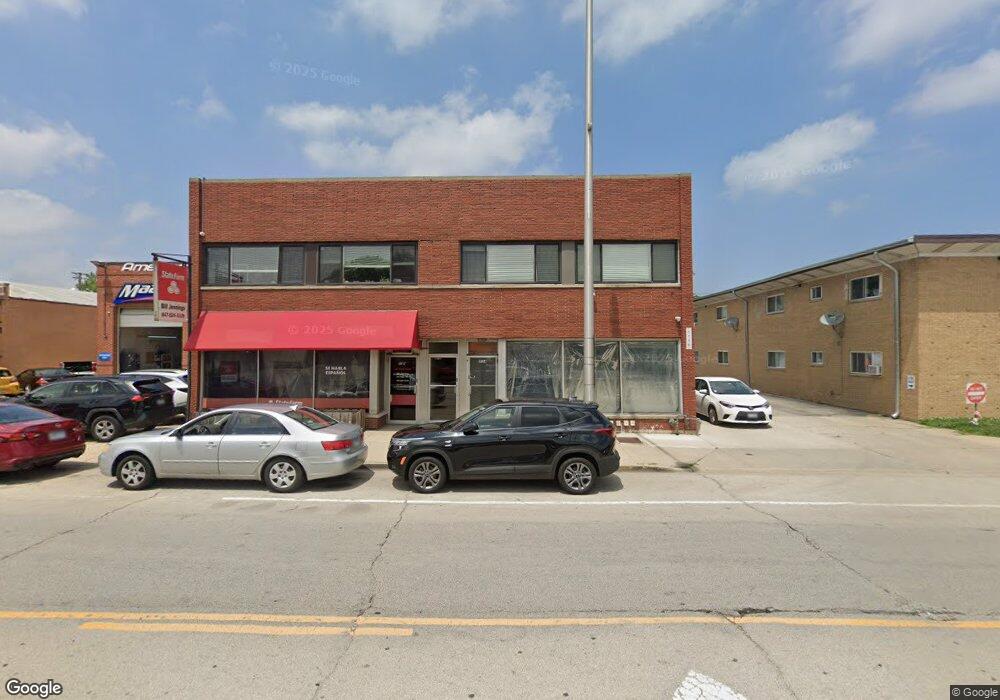
1732 E Oakton St Des Plaines, IL 60018
Estimated Value: $618,000 - $670,232
--
Bed
4
Baths
--
Sq Ft
0.27
Acres
About This Home
This home is located at 1732 E Oakton St, Des Plaines, IL 60018 and is currently estimated at $644,116. 1732 E Oakton St is a home located in Cook County with nearby schools including Central Elementary School, Chippewa Middle School, and Maine West High School.
Ownership History
Date
Name
Owned For
Owner Type
Purchase Details
Closed on
Jan 28, 2025
Sold by
Karabatsos Dexi
Bought by
Valdex Construction Corp
Current Estimated Value
Home Financials for this Owner
Home Financials are based on the most recent Mortgage that was taken out on this home.
Original Mortgage
$285,656
Outstanding Balance
$283,965
Interest Rate
6.93%
Mortgage Type
Credit Line Revolving
Estimated Equity
$360,151
Purchase Details
Closed on
Dec 18, 2019
Sold by
Kilbourn Properties 2000 Inc
Bought by
Karabatsos Dexi
Home Financials for this Owner
Home Financials are based on the most recent Mortgage that was taken out on this home.
Original Mortgage
$320,000
Interest Rate
3.7%
Mortgage Type
Commercial
Purchase Details
Closed on
Aug 21, 2018
Sold by
Hodaloma Llc Series 4
Bought by
Kilbourn Propertis 2000 Inc
Purchase Details
Closed on
May 11, 2018
Sold by
Chicago Title Land Trust Company
Bought by
Hodaloma Llc Series 4
Create a Home Valuation Report for This Property
The Home Valuation Report is an in-depth analysis detailing your home's value as well as a comparison with similar homes in the area
Home Values in the Area
Average Home Value in this Area
Purchase History
| Date | Buyer | Sale Price | Title Company |
|---|---|---|---|
| Valdex Construction Corp | -- | Chicago Title | |
| Karabatsos Dexi | $450,000 | Chicago Title | |
| Kilbourn Propertis 2000 Inc | $325,000 | First American Title | |
| Hodaloma Llc Series 4 | -- | Chicago Title Land Trust Com |
Source: Public Records
Mortgage History
| Date | Status | Borrower | Loan Amount |
|---|---|---|---|
| Open | Valdex Construction Corp | $285,656 | |
| Previous Owner | Karabatsos Dexi | $320,000 |
Source: Public Records
Tax History Compared to Growth
Tax History
| Year | Tax Paid | Tax Assessment Tax Assessment Total Assessment is a certain percentage of the fair market value that is determined by local assessors to be the total taxable value of land and additions on the property. | Land | Improvement |
|---|---|---|---|---|
| 2024 | $17,401 | $66,000 | $9,264 | $56,736 |
| 2023 | $16,983 | $66,000 | $9,264 | $56,736 |
| 2022 | $16,983 | $66,000 | $9,264 | $56,736 |
| 2021 | $13,832 | $45,000 | $7,527 | $37,473 |
| 2020 | $16,029 | $53,043 | $7,527 | $45,516 |
| 2019 | $16,408 | $60,970 | $7,527 | $53,443 |
| 2018 | $22,762 | $76,109 | $6,658 | $69,451 |
| 2017 | $22,359 | $76,109 | $6,658 | $69,451 |
| 2016 | $21,149 | $76,109 | $6,658 | $69,451 |
| 2015 | $13,927 | $46,069 | $5,790 | $40,279 |
| 2014 | $13,634 | $46,069 | $5,790 | $40,279 |
| 2013 | $13,294 | $46,069 | $5,790 | $40,279 |
Source: Public Records
Map
Nearby Homes
- 1640 S River Rd
- 1721 Linden St
- 1700 E Forest Ave
- 1928 Kennicott Ct
- 1724 Illinois St
- 1689 S Elm St
- 1278 E River Dr
- 1632 S Elm St
- 1509 Center St
- 1696 S Elm St
- 1489 E Algonquin Rd
- 1783 Lee St
- 2017 Pine St Unit B
- 2015 Busse Hwy
- 960 S River Rd Unit 410
- 960 S River Rd Unit 208
- 1524 Oakwood Ave
- 1010 Crabtree Ln
- 1050 E Oakton St
- 1365 Ashland Ave Unit 302
- 1716 E Oakton St
- 1744 E Oakton St Unit 205
- 1744 E Oakton St Unit 106
- 1744 E Oakton St Unit 105
- 1744 E Oakton St Unit 102
- 1744 E Oakton St Unit 202
- 1744 E Oakton St Unit 204
- 1744 E Oakton St Unit 101
- 1744 E Oakton St Unit 103
- 1744 E Oakton St Unit 203
- 1744 E Oakton St Unit 201
- 1744 E Oakton St Unit 206
- 1744 E Oakton St Unit 104
- 1744 E Oakton St Unit 203P7
- 1744 E Oakton St
- 1744 E Oakton St Unit 105-P3
- 1744 E Oakton St Unit 106-P4
- 1744 E Oakton St Unit 202-P6
- 1714 E Oakton St
- 1754 E Oakton St Unit 106