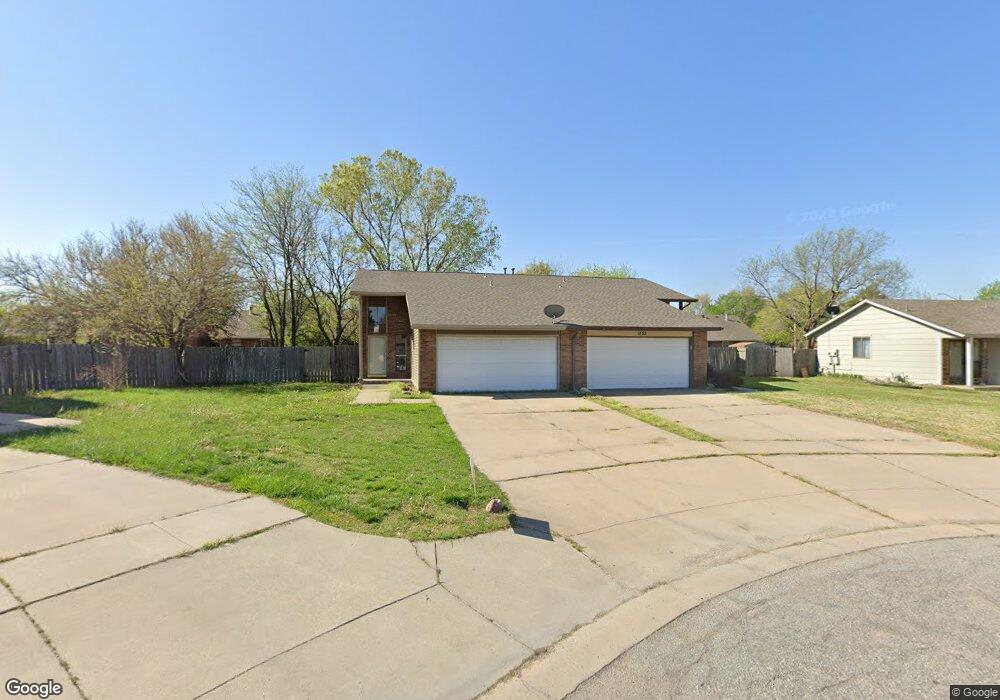
1732 S Beech Ct Wichita, KS 67207
Southeast Wichita NeighborhoodEstimated Value: $166,000 - $178,979
3
Beds
2
Baths
1,600
Sq Ft
$108/Sq Ft
Est. Value
About This Home
This home is located at 1732 S Beech Ct, Wichita, KS 67207 and is currently estimated at $172,490, approximately $107 per square foot. 1732 S Beech Ct is a home located in Sedgwick County with nearby schools including Beech Elementary School, Curtis Middle School, and Wichita Southeast High School.
Ownership History
Date
Name
Owned For
Owner Type
Purchase Details
Closed on
Feb 5, 2015
Sold by
Dem Llc
Bought by
Bn Properties Llc
Current Estimated Value
Home Financials for this Owner
Home Financials are based on the most recent Mortgage that was taken out on this home.
Original Mortgage
$76,000
Interest Rate
4.45%
Mortgage Type
Future Advance Clause Open End Mortgage
Purchase Details
Closed on
Feb 11, 2013
Sold by
Dillon Tommy G and Dillon Kristine M
Bought by
Dem Llc
Home Financials for this Owner
Home Financials are based on the most recent Mortgage that was taken out on this home.
Original Mortgage
$379,600
Interest Rate
3.38%
Mortgage Type
Future Advance Clause Open End Mortgage
Purchase Details
Closed on
Jul 3, 2007
Sold by
Delgado Dorothy J
Bought by
Dillon Tommy G
Home Financials for this Owner
Home Financials are based on the most recent Mortgage that was taken out on this home.
Original Mortgage
$72,000
Interest Rate
6.54%
Mortgage Type
Purchase Money Mortgage
Create a Home Valuation Report for This Property
The Home Valuation Report is an in-depth analysis detailing your home's value as well as a comparison with similar homes in the area
Home Values in the Area
Average Home Value in this Area
Purchase History
| Date | Buyer | Sale Price | Title Company |
|---|---|---|---|
| Bn Properties Llc | -- | Security 1St Title | |
| Dem Llc | -- | Security 1St Title | |
| Dillon Tommy G | -- | None Available |
Source: Public Records
Mortgage History
| Date | Status | Borrower | Loan Amount |
|---|---|---|---|
| Previous Owner | Bn Properties Llc | $76,000 | |
| Previous Owner | Dem Llc | $379,600 | |
| Previous Owner | Dillon Tommy G | $72,000 |
Source: Public Records
Tax History Compared to Growth
Tax History
| Year | Tax Paid | Tax Assessment Tax Assessment Total Assessment is a certain percentage of the fair market value that is determined by local assessors to be the total taxable value of land and additions on the property. | Land | Improvement |
|---|---|---|---|---|
| 2025 | $1,481 | $16,135 | $3,531 | $12,604 |
| 2023 | $1,481 | $14,410 | $2,461 | $11,949 |
| 2022 | $1,407 | $12,949 | $2,323 | $10,626 |
| 2021 | $1,422 | $12,570 | $1,346 | $11,224 |
| 2020 | $1,358 | $11,972 | $1,346 | $10,626 |
| 2019 | $1,306 | $11,512 | $1,346 | $10,166 |
| 2018 | $1,232 | $10,857 | $1,392 | $9,465 |
| 2017 | $1,233 | $0 | $0 | $0 |
| 2016 | $1,231 | $0 | $0 | $0 |
| 2015 | -- | $0 | $0 | $0 |
| 2014 | -- | $0 | $0 | $0 |
Source: Public Records
Map
Nearby Homes
- 1759 S Webb Rd
- 9413 E Bluestem St
- 1781 S Hoyt Cir
- 1950 S Webb Rd
- 2010 S Beech St
- 1717 S Cypress St
- Esperanza Plan at Buena Vista
- Ibiza Plan at Buena Vista
- Luciana Plan at Buena Vista
- Medina Plan at Buena Vista
- Sedona Plan at Buena Vista
- 1736 S Goebel St
- 9412 E Clark St
- 2022 S Webb Rd
- 1450 S Webb Rd
- 9618 E Annabelle St
- 1733 S Cranbrook Ct
- 10011 E Boston St
- 10211 E Countryside Cir
- 8655 E Mount Vernon St
- 1730 S Beech Ct
- 1736 S Beech Ct
- 1738 S Beech Ct
- 1726 S Beech Ct
- 9410 E Longlake St
- 9412 E Longlake St
- 1724 S Beech Ct
- 9416 E Longlake St
- 9404 E Longlake St
- 9418 E Longlake St
- 9402 E Longlake St
- 9424 E Longlake St
- 1720 S Beech Ct
- 1712 S Beech Ct
- 9426 E Longlake St
- 1708 S Beech Ct
- 1718 S Beech Ct
- 1714 S Beech Ct
- 1706 S Beech Ct
- 9324 E Funston St Unit 4