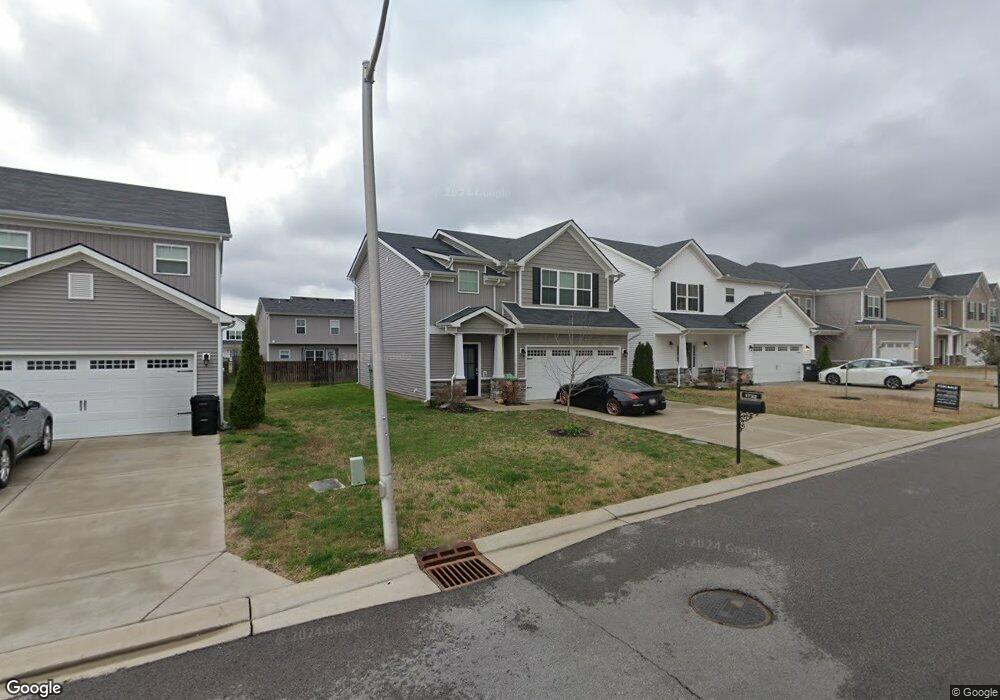
1732 Sunray Dr Unit 96 Murfreesboro, TN 37127
Estimated Value: $314,000 - $400,000
--
Bed
3
Baths
1,628
Sq Ft
$226/Sq Ft
Est. Value
About This Home
This home is located at 1732 Sunray Dr Unit 96, Murfreesboro, TN 37127 and is currently estimated at $368,121, approximately $226 per square foot. 1732 Sunray Dr Unit 96 is a home located in Rutherford County with nearby schools including Black Fox Elementary School, Buchanan Elementary School, and Christiana Middle School.
Ownership History
Date
Name
Owned For
Owner Type
Purchase Details
Closed on
May 10, 2022
Sold by
Mile High Tl Borrower 1 Core Llc
Bought by
Mile High Tl Borrower 1 Core Llc
Current Estimated Value
Purchase Details
Closed on
Oct 1, 2021
Sold by
Opendoor Property Trust I
Bought by
Mile High Borrower 1 Llc and Mile High Borrower 1 Core Llc
Purchase Details
Closed on
Sep 7, 2021
Sold by
Wade Joshua W and Wade Caitlin A
Bought by
Opendoor Property Trus Ti
Purchase Details
Closed on
Jul 6, 2018
Sold by
Obrien Loyd Llc
Bought by
Wade Joshua W and Wade Caitlin A
Home Financials for this Owner
Home Financials are based on the most recent Mortgage that was taken out on this home.
Original Mortgage
$11,145
Interest Rate
4.5%
Mortgage Type
Stand Alone Second
Create a Home Valuation Report for This Property
The Home Valuation Report is an in-depth analysis detailing your home's value as well as a comparison with similar homes in the area
Home Values in the Area
Average Home Value in this Area
Purchase History
| Date | Buyer | Sale Price | Title Company |
|---|---|---|---|
| Mile High Tl Borrower 1 Core Llc | -- | Selene Title | |
| Mile High Tl Borrower 1 Core Llc | -- | Selene Title | |
| Mile High Borrower 1 Llc | $340,000 | Os National Llc | |
| Opendoor Property Trus Ti | $287,200 | Tennessee Title Services Llc | |
| Opendoor Property Trust | $287,200 | Tennessee Title | |
| Wade Joshua W | $222,900 | None Available | |
| Obrien Loyd Llc | -- | None Available |
Source: Public Records
Mortgage History
| Date | Status | Borrower | Loan Amount |
|---|---|---|---|
| Previous Owner | Obrien Loyd Llc | $11,145 | |
| Previous Owner | Wade Joshua W | $218,862 |
Source: Public Records
Tax History Compared to Growth
Tax History
| Year | Tax Paid | Tax Assessment Tax Assessment Total Assessment is a certain percentage of the fair market value that is determined by local assessors to be the total taxable value of land and additions on the property. | Land | Improvement |
|---|---|---|---|---|
| 2025 | $1,984 | $70,150 | $13,750 | $56,400 |
| 2024 | $1,984 | $70,150 | $13,750 | $56,400 |
| 2023 | $1,316 | $70,150 | $13,750 | $56,400 |
| 2022 | $1,134 | $70,150 | $13,750 | $56,400 |
| 2021 | $1,111 | $50,075 | $8,750 | $41,325 |
| 2020 | $1,111 | $50,075 | $8,750 | $41,325 |
| 2019 | $1,111 | $50,075 | $8,750 | $41,325 |
Source: Public Records
Map
Nearby Homes
- 4218 Golden Sun Ct
- 1720 Sunray Dr
- 1740 Sunray Dr
- 4262 Golden Sun Ct
- 1825 Warmingfield Dr
- 4247 Aurora Cir
- 4203 Sarazen Ln
- 4316 Doral Dr
- 2410 Lightbend Dr
- 1843 Streamsong Dr
- 1845 Streamsong Dr
- 1847 Streamsong Dr
- 1840 Streamsong Dr
- 4335 Doral Dr
- 4325 Calusa Dr
- 4327 Calusa Dr
- 4329 Calusa Dr
- 4331 Calusa Dr
- 4335 Calusa Dr
- 4337 Calusa Dr
- 1732 Sunray Dr
- 1732 Sunray Dr
- 1736 Sunray Dr Unit 60
- 1736 Sunray Dr Unit 60
- 1736 Sunray Dr
- 1728 Sunray Dr
- 1728 Sunray Dr Unit 97
- 1728 Sunray Dr
- 1724 Sunray Dr Unit 98
- 1740 Sunray Dr Unit 61
- 1724 Sunray Dr
- 4214 Golden Sun Ct
- 4214 Golden Sun Ct Unit 95
- 4218 Golden Sun Ct
- 4210 Golden Sun Ct
- 4218 Golden Sun Ct Unit 94
- 1729 Sunray Dr Unit 128
- 1729 Sunray Dr
- 1737 Sunray Dr Unit 59
- 1737 Sunray Dr