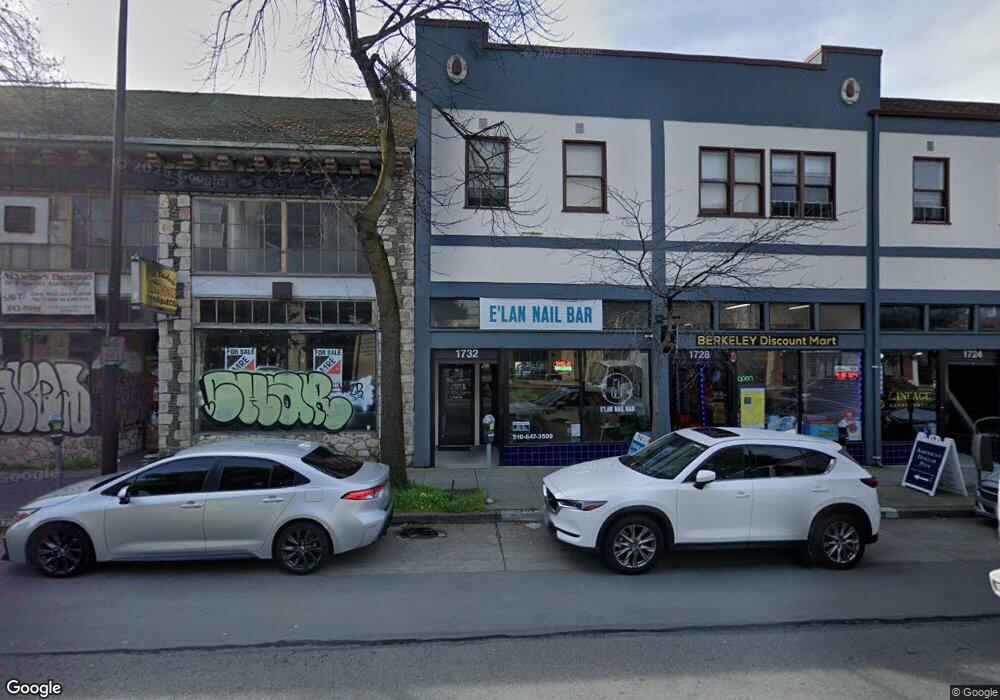
1732 University Ave Berkeley, CA 94703
Downtown Berkeley Neighborhood
Studio
--
Bath
17,610
Sq Ft
13,504
Sq Ft Lot
About This Home
This home is located at 1732 University Ave, Berkeley, CA 94703. 1732 University Ave is a home located in Alameda County with nearby schools including Washington Elementary School, Berkeley Arts Magnet at Whittier School, and Oxford Elementary School.
Ownership History
Date
Name
Owned For
Owner Type
Purchase Details
Closed on
Jul 19, 2019
Sold by
Kelly James J and Satake Alvin T
Bought by
Satake Alvin T and Satake Maxine R
Home Financials for this Owner
Home Financials are based on the most recent Mortgage that was taken out on this home.
Original Mortgage
$3,100,000
Interest Rate
3.8%
Mortgage Type
Commercial
Purchase Details
Closed on
Aug 22, 1997
Sold by
Satake Maxine
Bought by
Satake Alvin T
Home Financials for this Owner
Home Financials are based on the most recent Mortgage that was taken out on this home.
Original Mortgage
$114,900
Interest Rate
7.43%
Mortgage Type
Commercial
Purchase Details
Closed on
Aug 21, 1997
Sold by
Kelly Barbara V
Bought by
Kelly James J
Home Financials for this Owner
Home Financials are based on the most recent Mortgage that was taken out on this home.
Original Mortgage
$114,900
Interest Rate
7.43%
Mortgage Type
Commercial
Create a Home Valuation Report for This Property
The Home Valuation Report is an in-depth analysis detailing your home's value as well as a comparison with similar homes in the area
Home Values in the Area
Average Home Value in this Area
Purchase History
| Date | Buyer | Sale Price | Title Company |
|---|---|---|---|
| Satake Alvin T | -- | Chicago Title Company | |
| Satake Alvin T | -- | -- | |
| Kelly James J | -- | -- |
Source: Public Records
Mortgage History
| Date | Status | Borrower | Loan Amount |
|---|---|---|---|
| Closed | Satake Alvin T | $3,100,000 | |
| Closed | Satake Alvin T | $114,900 | |
| Closed | Kelly James J | $114,900 |
Source: Public Records
Tax History
| Year | Tax Paid | Tax Assessment Tax Assessment Total Assessment is a certain percentage of the fair market value that is determined by local assessors to be the total taxable value of land and additions on the property. | Land | Improvement |
|---|---|---|---|---|
| 2025 | $48,225 | $1,688,858 | $647,395 | $1,041,463 |
| 2024 | $48,225 | $1,655,747 | $634,703 | $1,021,044 |
| 2023 | $46,984 | $1,623,284 | $622,259 | $1,001,025 |
| 2022 | $45,582 | $1,591,460 | $610,060 | $981,400 |
| 2021 | $45,308 | $1,560,257 | $598,098 | $962,159 |
| 2020 | $41,392 | $1,544,264 | $591,968 | $952,296 |
| 2019 | $38,464 | $1,513,988 | $580,362 | $933,626 |
| 2018 | $37,476 | $1,484,306 | $568,984 | $915,322 |
| 2017 | $35,990 | $1,455,209 | $557,830 | $897,379 |
| 2016 | $34,851 | $1,426,680 | $546,894 | $879,786 |
| 2015 | $34,210 | $1,405,250 | $538,679 | $866,571 |
| 2014 | $34,076 | $1,377,728 | $528,129 | $849,599 |
Source: Public Records
Map
Nearby Homes
- 2218 -2222 Grant St
- 2118 California St
- 1813 Sacramento St
- 1436 Delaware St
- 1411 Hearst Ave Unit 2
- 1808 Cedar St
- 2015 Delaware St
- 2015 Delaware St Unit A
- 1625 Martin Luther King jr Way
- 1564 Sacramento St
- 1609 Bonita Ave Unit 5
- 1610 Milvia St
- 2350 Sacramento St
- 1815 Vine St
- 1645 Dwight Way
- 1322 Virginia St
- 1261 Hearst Ave
- 1368 Rose St
- 1425 Martin Luther King jr Way
- 1919 Curtis St
- 1722 University Ave
- 1718 University Ave
- 1716 University Ave
- 1710 University Ave
- 2009 McGee Ave Unit 4
- 2009 McGee Ave Unit 2
- 2009 McGee Ave
- 1700 University Ave
- 2013 McGee Ave
- 1711 Addison St
- 1715 Addison St
- 1709 Addison St
- 1719 Addison St
- 2015 McGee Ave
- 1721 Addison St
- 1727 Addison St
- 1725 University Ave
- 1717 University Ave
- 2008 McGee Ave
- 1698 University Ave
Your Personal Tour Guide
Ask me questions while you tour the home.