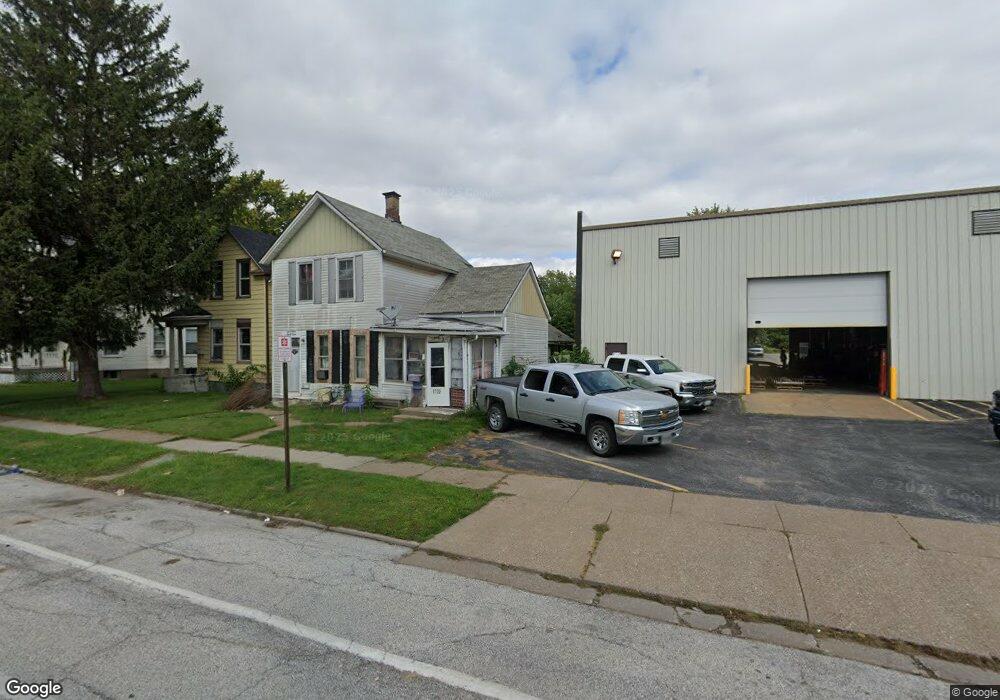
1732 W 4th St Davenport, IA 52802
Fejervary NeighborhoodEstimated Value: $54,000 - $71,108
3
Beds
2
Baths
1,252
Sq Ft
$51/Sq Ft
Est. Value
About This Home
This home is located at 1732 W 4th St, Davenport, IA 52802 and is currently estimated at $63,777, approximately $50 per square foot. 1732 W 4th St is a home located in Scott County with nearby schools including Walnut Hill Elementary School, South Christian Elementary School, and Wilson Elementary School.
Ownership History
Date
Name
Owned For
Owner Type
Purchase Details
Closed on
Mar 31, 2025
Sold by
No Boundry Llc
Bought by
Schaul Enterprises Llc
Current Estimated Value
Purchase Details
Closed on
Jul 12, 2024
Sold by
Scott County
Bought by
No Boundry Llc
Purchase Details
Closed on
Jun 11, 2013
Sold by
Lundquist Josette J and Lundquist Stephen F
Bought by
Avila Lo Jesus and Avila Lorraine
Purchase Details
Closed on
Oct 2, 2006
Sold by
Bettin Dale L
Bought by
Bettin Dale L and Lundquist Josette J
Create a Home Valuation Report for This Property
The Home Valuation Report is an in-depth analysis detailing your home's value as well as a comparison with similar homes in the area
Home Values in the Area
Average Home Value in this Area
Purchase History
| Date | Buyer | Sale Price | Title Company |
|---|---|---|---|
| Schaul Enterprises Llc | $35,000 | None Listed On Document | |
| No Boundry Llc | $2,491 | None Listed On Document | |
| Avila Lo Jesus | $20,000 | None Available | |
| Bettin Dale L | -- | None Available |
Source: Public Records
Tax History Compared to Growth
Tax History
| Year | Tax Paid | Tax Assessment Tax Assessment Total Assessment is a certain percentage of the fair market value that is determined by local assessors to be the total taxable value of land and additions on the property. | Land | Improvement |
|---|---|---|---|---|
| 2025 | $826 | $51,530 | $6,750 | $44,780 |
| 2024 | $1,688 | $46,250 | $6,750 | $39,500 |
| 2023 | $1,722 | $46,250 | $6,750 | $39,500 |
| 2022 | $1,549 | $37,420 | $4,800 | $32,620 |
| 2021 | $800 | $37,320 | $4,800 | $32,520 |
| 2020 | $1,310 | $34,910 | $4,800 | $30,110 |
| 2019 | $2,475 | $31,900 | $4,800 | $27,100 |
| 2018 | $1,549 | $31,900 | $4,800 | $27,100 |
| 2017 | $692 | $30,390 | $4,800 | $25,590 |
| 2016 | $854 | $30,390 | $0 | $0 |
| 2015 | $666 | $32,740 | $0 | $0 |
| 2014 | $728 | $32,740 | $0 | $0 |
| 2013 | $714 | $0 | $0 | $0 |
| 2012 | -- | $39,270 | $4,360 | $34,910 |
Source: Public Records
Map
Nearby Homes