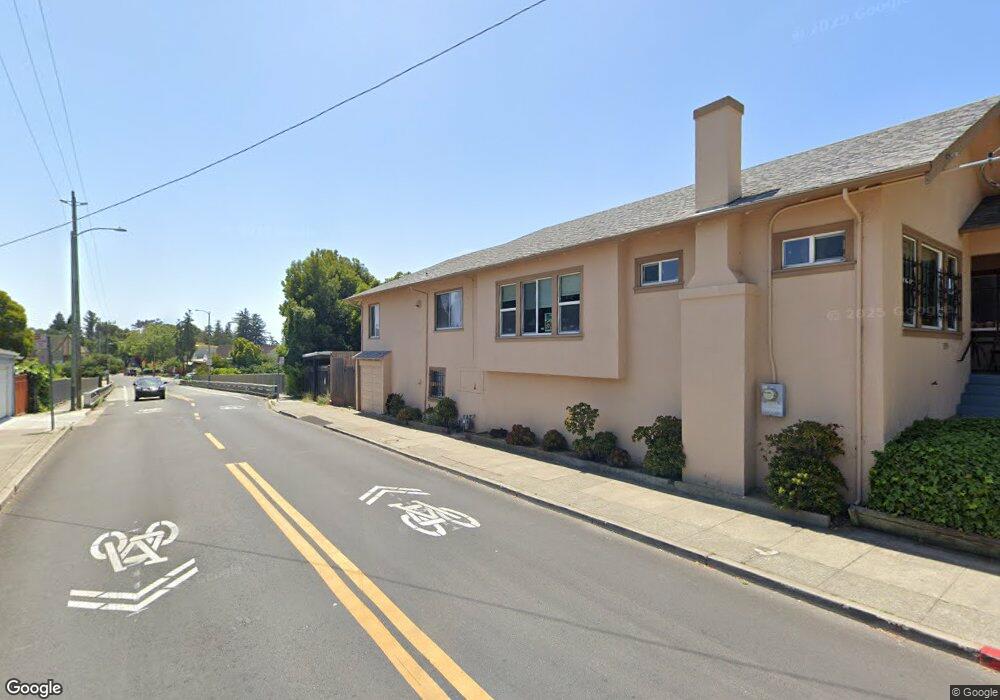
1733 Macarthur Blvd Oakland, CA 94602
Glenview NeighborhoodEstimated Value: $647,000 - $929,000
About This Home
Welcome to this unique and charming 3 bedroom & 1.5 bath bungalow home located in the heart of Dimond District neighborhood, MacArthur, Oakland. It is situated on a corner lot but slightly raised from the street level with grand front porch, fresh interior paints, original wood wainscoting, tray ceiling, hardwood floors, period-details throughout, formal dining room with built-in cabinets. A fabulous attached one car garage and basement / storage, close to shops, restaurants, bus stops and easy Freeway access.
Tenant application process involves credit check. Recent paystubs and no prior evictions.
Section 8 okay
Large dining room and living space
Central heat and double-pane windows
Spacious basement for all your storage needs and laundry hookups. Also includes 1 car garage.
Fantastic location close to Temescal, Piedmont, Downtown Oakland, 580 and Fruitvale BART Station.
Just a stone's throw from Farmer Joes, Grand Lake Kitchen, Paulista, Dimond Slice and many other great local shops and restaurants.
Available immediately
Renter's Insurance Required
This is a non-smoking property
No pets allowed
One-Year lease minimum
Garbage included. All other utilities tenant pays for.
Ownership History
Purchase Details
Home Values in the Area
Average Home Value in this Area
Purchase History
| Date | Buyer | Sale Price | Title Company |
|---|---|---|---|
| Chan Yvonne Qi Fan | -- | None Available |
Property History
| Date | Event | Price | List to Sale | Price per Sq Ft |
|---|---|---|---|---|
| 08/30/2024 08/30/24 | For Rent | $3,400 | -- | -- |
Tax History Compared to Growth
Tax History
| Year | Tax Paid | Tax Assessment Tax Assessment Total Assessment is a certain percentage of the fair market value that is determined by local assessors to be the total taxable value of land and additions on the property. | Land | Improvement |
|---|---|---|---|---|
| 2025 | $3,756 | $154,370 | $22,343 | $132,027 |
| 2024 | $3,756 | $151,344 | $21,905 | $129,439 |
| 2023 | $3,834 | $148,376 | $21,475 | $126,901 |
| 2022 | $3,574 | $138,467 | $21,054 | $124,413 |
| 2021 | $3,279 | $135,614 | $20,641 | $121,973 |
| 2020 | $3,241 | $141,153 | $20,430 | $120,723 |
| 2019 | $3,032 | $138,385 | $20,029 | $118,356 |
| 2018 | $2,970 | $135,672 | $19,636 | $116,036 |
| 2017 | $2,824 | $133,012 | $19,251 | $113,761 |
| 2016 | $2,332 | $130,404 | $18,874 | $111,530 |
| 2015 | $2,628 | $128,445 | $18,590 | $109,855 |
| 2014 | $2,555 | $125,930 | $18,226 | $107,704 |
Map
- 1703 Macarthur Blvd
- 1701 Macarthur Blvd
- 1777 Sausal St
- 2106 Woodbine Ave
- 3186 Mckillop Rd
- 2550 Pleasant St
- 1621 E 38th St
- 3541 Dimond Ave
- 2628 School St
- 2240 Macarthur Blvd
- 3464 Champion St
- 3220 Champion St
- 1600 E 31st St
- 1515 Hampel St
- 2133 E 30th St
- 1930 E 30th St
- 3945 Randolph Ave Unit 2
- 2795 25th Ave
- 3477 Boston Ave Unit 4
- 3086 Capp St
- 1727 Macarthur Blvd
- 1751 Macarthur Blvd
- 1755 Macarthur Blvd
- 3455 Morrison Ave
- 3457 Morrison Ave
- 1691 Macarthur Blvd
- 3454 Morrison Ave
- 1685 Macarthur Blvd
- 1679 Macarthur Blvd
- 3401 Sheffield Ave
- 1809 Montana St
- 1801 Macarthur Blvd
- 1673 Macarthur Blvd
- 1678 Macarthur Blvd
- 3259 Sheffield Ave
- 1815 Montana St
- 1663 Macarthur Blvd
- 3256 Sheffield Ave
- 1683 Miami Ct