
1733 Sea Fair Dr Saint Augustine, FL 32080
Butler and Crescent Beaches Neighborhood
2
Beds
2.5
Baths
1,057
Sq Ft
$450/mo
HOA Fee
Highlights
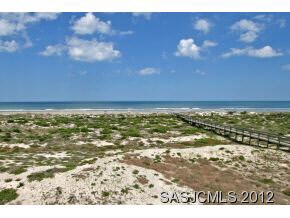
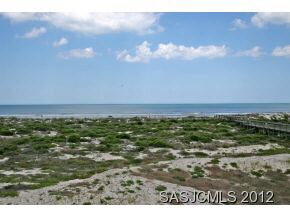
- Ocean Front
- Beach Access
- Clubhouse
- W. Douglas Hartley Elementary School Rated A
- RV or Boat Storage in Community
- Traditional Architecture
About This Home
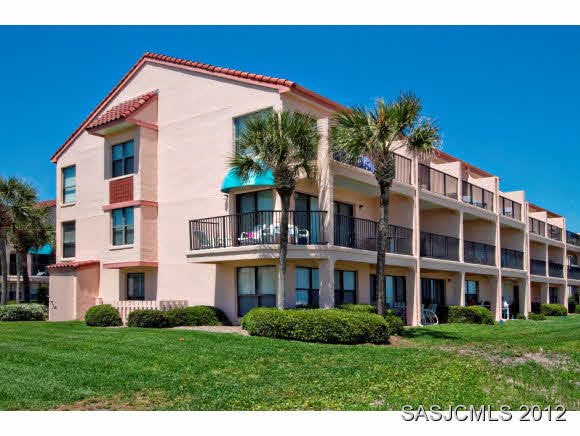
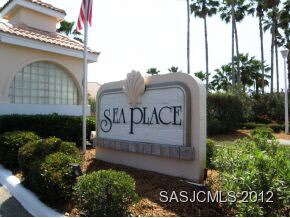
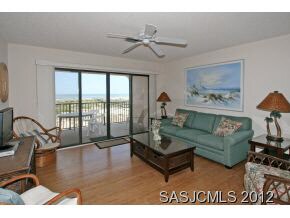
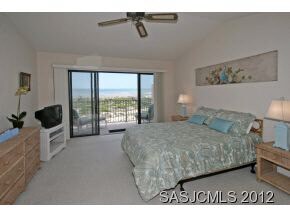
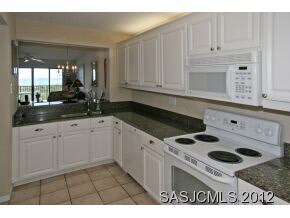
As of June 2024This townhouse offers stunning panoramic ocean front views. A private balcony is found upstairs off the master and downstairs off the living room. Bamboo floors, granite in the kitchen, new light fixtures and other recent upgrades sets this one apart from the average. Sea Place offers two pools, clubhouse, boat storage, tennis, racquet ball and private beach access. A popular resort destination close to fine restaurants, shopping, etc and where short term rentals are allowed.
Last Agent to Sell the Property
Greg Crum
Engel & Völkers St Augustine Listed on: 05/10/2012
Property Details
Home Type
- Condominium
Est. Annual Taxes
- $4,040
Year Built
- Built in 1985
HOA Fees
- $450 Monthly HOA Fees
Parking
- Unassigned Parking
Home Design
- Traditional Architecture
- Concrete Block With Brick
- Slab Foundation
- Stucco Exterior
Interior Spaces
- 1,057 Sq Ft Home
- 2-Story Property
- Window Treatments
- Dining Room
Kitchen
- Range
- Dishwasher
Flooring
- Wood
- Carpet
- Tile
Bedrooms and Bathrooms
- 2 Bedrooms
Laundry
- Dryer
- Washer
Schools
- W. D. Hartley Elementary School
- Gamble Rogers Middle School
- Pedro Menendez High School
Additional Features
- Beach Access
- Ocean Front
- Central Heating and Cooling System
Listing and Financial Details
- Lease Option
- Assessor Parcel Number 175757 1209
Community Details
Overview
- Association fees include cable, community maintained, internal pest control, maintenance exterior, management, master policy, sewer, termite bond
Amenities
- Clubhouse
Recreation
- RV or Boat Storage in Community
- Tennis Courts
- Racquetball
- Community Pool
Similar Homes in Saint Augustine, FL
Create a Home Valuation Report for This Property
The Home Valuation Report is an in-depth analysis detailing your home's value as well as a comparison with similar homes in the area
Home Values in the Area
Average Home Value in this Area
Mortgage History
| Date | Status | Loan Amount | Loan Type |
|---|---|---|---|
| Closed | $15,000 | Credit Line Revolving |
Source: Public Records
Property History
| Date | Event | Price | Change | Sq Ft Price |
|---|---|---|---|---|
| 07/17/2025 07/17/25 | Pending | -- | -- | -- |
| 05/14/2025 05/14/25 | Price Changed | $469,000 | -2.1% | $409 / Sq Ft |
| 05/01/2025 05/01/25 | For Sale | $479,000 | -0.2% | $417 / Sq Ft |
| 06/28/2024 06/28/24 | Sold | $480,000 | 0.0% | $435 / Sq Ft |
| 05/17/2024 05/17/24 | Price Changed | $479,900 | -3.0% | $435 / Sq Ft |
| 05/10/2024 05/10/24 | Price Changed | $494,500 | -1.1% | $448 / Sq Ft |
| 03/31/2024 03/31/24 | For Sale | $499,900 | +42.8% | $453 / Sq Ft |
| 12/17/2023 12/17/23 | Off Market | $350,000 | -- | -- |
| 03/17/2023 03/17/23 | Sold | $500,000 | 0.0% | $453 / Sq Ft |
| 12/21/2022 12/21/22 | Off Market | $500,000 | -- | -- |
| 08/05/2022 08/05/22 | Sold | $599,900 | +13.2% | $543 / Sq Ft |
| 08/03/2022 08/03/22 | Pending | -- | -- | -- |
| 07/30/2022 07/30/22 | Price Changed | $529,900 | -5.2% | $480 / Sq Ft |
| 06/26/2022 06/26/22 | For Sale | $559,000 | -6.8% | $506 / Sq Ft |
| 05/18/2022 05/18/22 | For Sale | $599,900 | +33.3% | $543 / Sq Ft |
| 11/16/2021 11/16/21 | Sold | $450,000 | -7.2% | $408 / Sq Ft |
| 10/10/2021 10/10/21 | Price Changed | $485,000 | -2.0% | $439 / Sq Ft |
| 10/01/2021 10/01/21 | For Sale | $495,000 | +30.3% | $448 / Sq Ft |
| 06/23/2021 06/23/21 | Sold | $380,000 | -11.7% | $360 / Sq Ft |
| 06/18/2021 06/18/21 | Sold | $430,255 | +2.7% | $375 / Sq Ft |
| 06/06/2021 06/06/21 | Pending | -- | -- | -- |
| 05/26/2021 05/26/21 | For Sale | $419,000 | +10.3% | $365 / Sq Ft |
| 05/24/2021 05/24/21 | Pending | -- | -- | -- |
| 05/06/2021 05/06/21 | For Sale | $380,000 | -20.0% | $360 / Sq Ft |
| 12/09/2020 12/09/20 | Sold | $475,000 | 0.0% | $414 / Sq Ft |
| 11/20/2020 11/20/20 | Pending | -- | -- | -- |
| 11/18/2020 11/18/20 | For Sale | $475,000 | +14.2% | $414 / Sq Ft |
| 08/11/2020 08/11/20 | Sold | $416,000 | -3.0% | $377 / Sq Ft |
| 05/14/2020 05/14/20 | For Sale | $429,000 | +11.7% | $389 / Sq Ft |
| 12/05/2019 12/05/19 | Sold | $384,100 | -3.6% | $348 / Sq Ft |
| 12/04/2019 12/04/19 | Pending | -- | -- | -- |
| 09/24/2019 09/24/19 | Price Changed | $398,500 | -0.4% | $361 / Sq Ft |
| 08/07/2019 08/07/19 | For Sale | $399,900 | +18.0% | $362 / Sq Ft |
| 08/31/2018 08/31/18 | Sold | $339,000 | -1.2% | $295 / Sq Ft |
| 08/28/2018 08/28/18 | Pending | -- | -- | -- |
| 08/26/2018 08/26/18 | For Sale | $343,000 | -18.3% | $299 / Sq Ft |
| 01/16/2018 01/16/18 | Sold | $420,000 | -2.3% | $397 / Sq Ft |
| 01/15/2018 01/15/18 | Pending | -- | -- | -- |
| 01/12/2018 01/12/18 | Sold | $430,000 | -2.1% | $389 / Sq Ft |
| 12/18/2017 12/18/17 | Pending | -- | -- | -- |
| 12/18/2017 12/18/17 | For Sale | $439,000 | +1.2% | $398 / Sq Ft |
| 11/01/2017 11/01/17 | For Sale | $434,000 | +55.0% | $411 / Sq Ft |
| 06/12/2017 06/12/17 | Sold | $280,000 | -17.6% | $254 / Sq Ft |
| 06/05/2017 06/05/17 | Pending | -- | -- | -- |
| 05/17/2017 05/17/17 | Sold | $340,000 | -5.5% | $308 / Sq Ft |
| 05/16/2017 05/16/17 | Pending | -- | -- | -- |
| 01/12/2017 01/12/17 | For Sale | $359,900 | +29.5% | $326 / Sq Ft |
| 08/01/2016 08/01/16 | Sold | $278,000 | -0.7% | $242 / Sq Ft |
| 08/01/2016 08/01/16 | Pending | -- | -- | -- |
| 06/09/2016 06/09/16 | For Sale | $279,900 | -6.4% | $244 / Sq Ft |
| 03/24/2016 03/24/16 | For Sale | $299,000 | +32.9% | $271 / Sq Ft |
| 11/02/2015 11/02/15 | Sold | $225,000 | -6.3% | $213 / Sq Ft |
| 10/30/2015 10/30/15 | Pending | -- | -- | -- |
| 05/29/2015 05/29/15 | Sold | $240,000 | -7.3% | $227 / Sq Ft |
| 04/06/2015 04/06/15 | Pending | -- | -- | -- |
| 03/25/2015 03/25/15 | For Sale | $259,000 | -0.4% | $245 / Sq Ft |
| 02/03/2015 02/03/15 | For Sale | $260,000 | 0.0% | $246 / Sq Ft |
| 12/15/2014 12/15/14 | Sold | $260,000 | -31.0% | $246 / Sq Ft |
| 12/07/2014 12/07/14 | Pending | -- | -- | -- |
| 10/20/2014 10/20/14 | Sold | $377,000 | +37.1% | $240 / Sq Ft |
| 09/24/2014 09/24/14 | Pending | -- | -- | -- |
| 08/04/2014 08/04/14 | Sold | $275,000 | 0.0% | $249 / Sq Ft |
| 08/04/2014 08/04/14 | Pending | -- | -- | -- |
| 07/04/2014 07/04/14 | For Sale | $275,000 | +13.6% | $260 / Sq Ft |
| 07/03/2014 07/03/14 | Sold | $242,000 | +12.6% | $211 / Sq Ft |
| 07/03/2014 07/03/14 | Pending | -- | -- | -- |
| 06/27/2014 06/27/14 | Sold | $215,000 | -25.6% | $203 / Sq Ft |
| 06/27/2014 06/27/14 | Pending | -- | -- | -- |
| 05/12/2014 05/12/14 | Sold | $289,000 | 0.0% | $252 / Sq Ft |
| 05/05/2014 05/05/14 | Pending | -- | -- | -- |
| 04/18/2014 04/18/14 | For Sale | $289,000 | 0.0% | $262 / Sq Ft |
| 03/27/2014 03/27/14 | For Sale | $289,000 | +14.2% | $252 / Sq Ft |
| 02/12/2014 02/12/14 | For Sale | $253,000 | +9.5% | $220 / Sq Ft |
| 01/02/2014 01/02/14 | Sold | $231,000 | +10.0% | $219 / Sq Ft |
| 01/02/2014 01/02/14 | Pending | -- | -- | -- |
| 01/01/2014 01/01/14 | For Sale | $210,000 | -40.8% | $199 / Sq Ft |
| 12/24/2013 12/24/13 | Sold | $354,500 | +29.4% | $335 / Sq Ft |
| 12/24/2013 12/24/13 | Pending | -- | -- | -- |
| 12/06/2013 12/06/13 | For Sale | $274,000 | -26.9% | $259 / Sq Ft |
| 10/19/2013 10/19/13 | For Sale | $375,000 | +66.7% | $355 / Sq Ft |
| 09/27/2013 09/27/13 | Sold | $225,000 | -10.0% | $213 / Sq Ft |
| 09/27/2013 09/27/13 | Pending | -- | -- | -- |
| 09/25/2013 09/25/13 | Sold | $250,000 | -40.3% | $237 / Sq Ft |
| 09/25/2013 09/25/13 | Pending | -- | -- | -- |
| 09/24/2013 09/24/13 | For Sale | $419,000 | +67.6% | $267 / Sq Ft |
| 08/14/2013 08/14/13 | For Sale | $250,000 | +6.4% | $237 / Sq Ft |
| 08/05/2013 08/05/13 | Sold | $235,000 | +2.2% | $205 / Sq Ft |
| 08/01/2013 08/01/13 | Pending | -- | -- | -- |
| 07/31/2013 07/31/13 | Sold | $230,000 | -28.1% | $200 / Sq Ft |
| 07/23/2013 07/23/13 | Sold | $320,000 | +33.9% | $290 / Sq Ft |
| 07/23/2013 07/23/13 | Pending | -- | -- | -- |
| 07/22/2013 07/22/13 | Pending | -- | -- | -- |
| 06/11/2013 06/11/13 | For Sale | $239,000 | -4.2% | $226 / Sq Ft |
| 04/25/2013 04/25/13 | For Sale | $249,500 | +4.2% | $217 / Sq Ft |
| 03/19/2013 03/19/13 | For Sale | $239,500 | -32.5% | $209 / Sq Ft |
| 02/11/2013 02/11/13 | Sold | $355,000 | +7.6% | $327 / Sq Ft |
| 02/11/2013 02/11/13 | Pending | -- | -- | -- |
| 02/01/2013 02/01/13 | For Sale | $330,000 | +4.8% | $299 / Sq Ft |
| 12/28/2012 12/28/12 | Sold | $315,000 | -10.0% | $285 / Sq Ft |
| 12/21/2012 12/21/12 | Sold | $350,000 | 0.0% | $331 / Sq Ft |
| 12/21/2012 12/21/12 | Sold | $350,000 | -16.5% | $331 / Sq Ft |
| 12/21/2012 12/21/12 | For Sale | $419,000 | +132.8% | $396 / Sq Ft |
| 12/12/2012 12/12/12 | Pending | -- | -- | -- |
| 12/04/2012 12/04/12 | Pending | -- | -- | -- |
| 11/15/2012 11/15/12 | Pending | -- | -- | -- |
| 09/17/2012 09/17/12 | Sold | $180,000 | -2.7% | $170 / Sq Ft |
| 08/29/2012 08/29/12 | Pending | -- | -- | -- |
| 08/22/2012 08/22/12 | For Sale | $184,900 | -55.9% | $175 / Sq Ft |
| 05/10/2012 05/10/12 | For Sale | $419,000 | +92.6% | $396 / Sq Ft |
| 04/12/2012 04/12/12 | Sold | $217,500 | +8.8% | $189 / Sq Ft |
| 04/11/2012 04/11/12 | Pending | -- | -- | -- |
| 04/06/2012 04/06/12 | Sold | $200,000 | +8.3% | $181 / Sq Ft |
| 04/06/2012 04/06/12 | Sold | $184,600 | +2.6% | $167 / Sq Ft |
| 04/06/2012 04/06/12 | Pending | -- | -- | -- |
| 03/19/2012 03/19/12 | Pending | -- | -- | -- |
| 03/16/2012 03/16/12 | Sold | $180,000 | -12.2% | $163 / Sq Ft |
| 03/04/2012 03/04/12 | Pending | -- | -- | -- |
| 02/29/2012 02/29/12 | Sold | $205,000 | -10.5% | $186 / Sq Ft |
| 02/29/2012 02/29/12 | Pending | -- | -- | -- |
| 02/08/2012 02/08/12 | For Sale | $229,000 | +1.8% | $199 / Sq Ft |
| 12/28/2011 12/28/11 | For Sale | $225,000 | +13.1% | $204 / Sq Ft |
| 12/07/2011 12/07/11 | For Sale | $199,000 | -0.5% | $180 / Sq Ft |
| 10/13/2011 10/13/11 | For Sale | $199,900 | -46.7% | $181 / Sq Ft |
| 09/02/2011 09/02/11 | For Sale | $375,000 | -6.3% | $340 / Sq Ft |
| 06/07/2011 06/07/11 | For Sale | $400,000 | +60.1% | $369 / Sq Ft |
| 04/19/2011 04/19/11 | For Sale | $249,900 | -- | $226 / Sq Ft |
Source: St. Augustine and St. Johns County Board of REALTORS®
Tax History Compared to Growth
Tax History
| Year | Tax Paid | Tax Assessment Tax Assessment Total Assessment is a certain percentage of the fair market value that is determined by local assessors to be the total taxable value of land and additions on the property. | Land | Improvement |
|---|---|---|---|---|
| 2025 | -- | -- | -- | -- |
| 2024 | -- | -- | -- | -- |
| 2023 | -- | -- | -- | -- |
| 2022 | -- | -- | -- | -- |
| 2021 | $0 | $0 | $0 | $0 |
| 2020 | $0 | $0 | $0 | $0 |
| 2019 | $0 | $0 | $0 | $0 |
| 2018 | $0 | $0 | $0 | $0 |
| 2016 | -- | $0 | $0 | $0 |
| 2015 | -- | $0 | $0 | $0 |
Source: Public Records
Agents Affiliated with this Home
-
Tom Scheirer
Seller's Agent in 2025
Tom Scheirer
Scheirer Realty
(202) 301-3929
49 in this area
93 Total Sales
-
Luke Newcomer
Buyer's Agent in 2024
Luke Newcomer
The Newcomer Group
(917) 294-6616
218 in this area
1,442 Total Sales
-
N
Buyer's Agent in 2023
NON MLS NON MLS
Non Member Office
-
Amy Wilson
Buyer's Agent in 2022
Amy Wilson
Olde Florida Realty Group
(904) 333-2196
11 in this area
63 Total Sales
-
Jason Neely
Seller's Agent in 2021
Jason Neely
Landmark Realty Inc
(904) 501-0947
46 in this area
120 Total Sales
-
Tanya Shaffer
T
Seller's Agent in 2021
Tanya Shaffer
HALLMARKADAMS
(386) 397-4766
1 in this area
42 Total Sales
Map
Source: St. Augustine and St. Johns County Board of REALTORS®
MLS Number: 136663
APN: 175757-0001
Disclaimer: Certain information contained herein is derived from information provided by parties other than Homes.com. All information provided is deemed reliable, but is not guaranteed to be accurate and should be independently verified.
![]() IDX information is provided exclusively for personal, non-commercial use, and may not be used for any purpose other than to identify prospective properties consumers may be interested in purchasing.
IDX information is provided exclusively for personal, non-commercial use, and may not be used for any purpose other than to identify prospective properties consumers may be interested in purchasing.
Information is deemed reliable but not guaranteed.
© 2025 St Augustine &
St. Johns County Board of REALTORS®. All rights reserved.
Nearby Homes
- 1733 Sea Fair Dr Unit 12230
- 128 Tide Watch Dr
- 205 Pacifica Vista Way
- 1 Dondanville Rd Unit 116C
- 1 Dondanville Rd Unit 216C
- 1 Dondanville Rd Unit C 215
- 2 Dondanville Rd Unit 115
- 2 Dondanville Rd Unit 216
- 2 Dondanville Rd Unit 101
- 2 Dondanville Rd Unit 110
- 2 Dondanville Rd Unit 212
- 99 Village Del Prado Cir
- 87 Village Del Lago Cir
- 52 Village Del Lago Cir
- 46 Village Del Prado Cir
- 21 Dondanville Rd Unit 20
- 66 Village Del Lago Cir Unit 6
- 17 Village Del Prado Cir
- 302 Aegean Vista Way
- 301 Premiere Vista Way