Estimated Value: $394,000 - $416,941
4
Beds
2
Baths
1,248
Sq Ft
$326/Sq Ft
Est. Value
About This Home
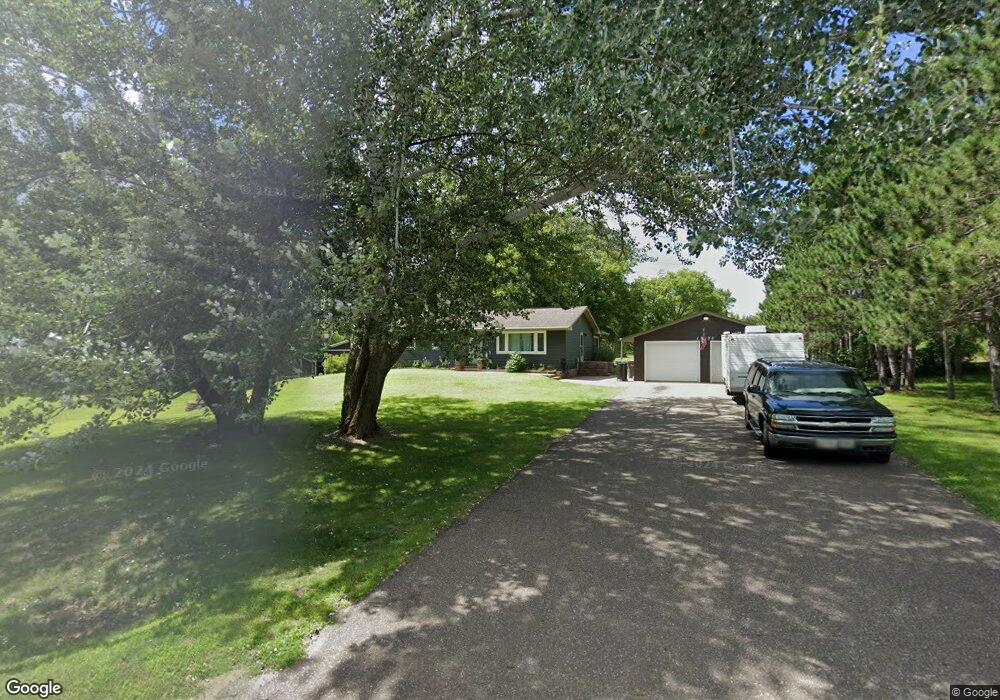
This home is located at 17330 Chameleon St NW, Anoka, MN 55303 and is currently estimated at $406,735, approximately $325 per square foot. 17330 Chameleon St NW is a home located in Anoka County with nearby schools including Twin Lakes Elementary School, Salk Middle School, and Elk River Senior High School.
Ownership History
Date
Name
Owned For
Owner Type
Purchase Details
Closed on
Nov 3, 2017
Sold by
Hanna David and Hanna Christin
Bought by
Swanson Jon and Swanson Katyryn
Current Estimated Value
Home Financials for this Owner
Home Financials are based on the most recent Mortgage that was taken out on this home.
Original Mortgage
$191,920
Outstanding Balance
$133,562
Interest Rate
3.83%
Mortgage Type
New Conventional
Estimated Equity
$273,173
Purchase Details
Closed on
Oct 8, 2015
Sold by
Kerber Thomas F and Kerber Nora
Bought by
Hanna David and Hanna Christi
Home Financials for this Owner
Home Financials are based on the most recent Mortgage that was taken out on this home.
Original Mortgage
$171,920
Interest Rate
3.91%
Mortgage Type
New Conventional
Purchase Details
Closed on
Dec 18, 2001
Sold by
Briesch Rhonda J and Briesch Raymond R
Bought by
Anderson Eric L and Anderson Susan M
Purchase Details
Closed on
Apr 18, 1997
Sold by
Chergosky Paul B and Chergosky Jeanette D
Bought by
Briesch Raymond R and Briesch Rhonda J
Create a Home Valuation Report for This Property
The Home Valuation Report is an in-depth analysis detailing your home's value as well as a comparison with similar homes in the area
Home Values in the Area
Average Home Value in this Area
Purchase History
| Date | Buyer | Sale Price | Title Company |
|---|---|---|---|
| Swanson Jon | $239,900 | Sherburne Co Abstract & Titl | |
| Hanna David | $214,900 | Burnet Title | |
| Anderson Eric L | $173,000 | -- | |
| Briesch Raymond R | $118,500 | -- |
Source: Public Records
Mortgage History
| Date | Status | Borrower | Loan Amount |
|---|---|---|---|
| Open | Swanson Jon | $191,920 | |
| Previous Owner | Hanna David | $171,920 |
Source: Public Records
Tax History Compared to Growth
Tax History
| Year | Tax Paid | Tax Assessment Tax Assessment Total Assessment is a certain percentage of the fair market value that is determined by local assessors to be the total taxable value of land and additions on the property. | Land | Improvement |
|---|---|---|---|---|
| 2025 | $4,426 | $369,300 | $140,500 | $228,800 |
| 2024 | $4,426 | $349,100 | $124,600 | $224,500 |
| 2023 | $4,161 | $345,500 | $121,600 | $223,900 |
| 2022 | $3,661 | $342,800 | $107,600 | $235,200 |
| 2021 | $3,427 | $278,000 | $89,500 | $188,500 |
| 2020 | $3,336 | $258,600 | $80,000 | $178,600 |
| 2019 | $2,770 | $245,500 | $80,000 | $165,500 |
| 2018 | $2,771 | $222,400 | $0 | $0 |
| 2017 | $2,516 | $214,400 | $0 | $0 |
| 2016 | $2,365 | $177,800 | $0 | $0 |
| 2015 | $3,074 | $177,800 | $57,600 | $120,200 |
| 2014 | -- | $153,000 | $53,700 | $99,300 |
Source: Public Records
Map
Nearby Homes
- 7442 171st Ln NW
- 17041 Uranimite St NW
- Ashlyn Plan at Trott Brook Crossing
- Hudson Plan at Trott Brook Crossing
- Kenny Plan at Trott Brook Crossing
- Sully Plan at Trott Brook Crossing
- Nora Plan at Trott Brook Crossing
- Henry Plan at Trott Brook Crossing
- Arlow Plan at Trott Brook Crossing
- Alley Plan at Trott Brook Crossing
- 17053 Uranimite St NW
- 7472 170th Ave NW
- 17013 Traprock NW
- 7331 175th Ave NW
- 17007 Traprock St NW
- 17000 Jackal St NW
- 7230 175th Ave NW
- 74xx 181st Ave NW
- 17950 Nowthen Blvd NW
- 16401 Kangaroo St NW
- 17410 Chameleon St NW
- 17411 Chameleon St NW
- 17331 Chameleon St NW
- 17420 Chameleon St NW
- 17325 Chameleon St NW
- 17431 Chameleon St NW
- 17310 Chameleon St NW
- 7965 173rd Ave NW
- 17510 Chameleon St NW
- 17511 Chameleon St NW
- 7831 173rd Ave NW
- 7910 173rd Ave NW
- 17520 Chameleon St NW
- 7956 173rd Ave NW
- 17521 Chameleon St NW
- 7705 173rd Ave NW
- 8055 173rd Ave NW
- 17230 Zeolite St NW
- 17531 Chameleon St NW
- 17530 Chameleon St NW