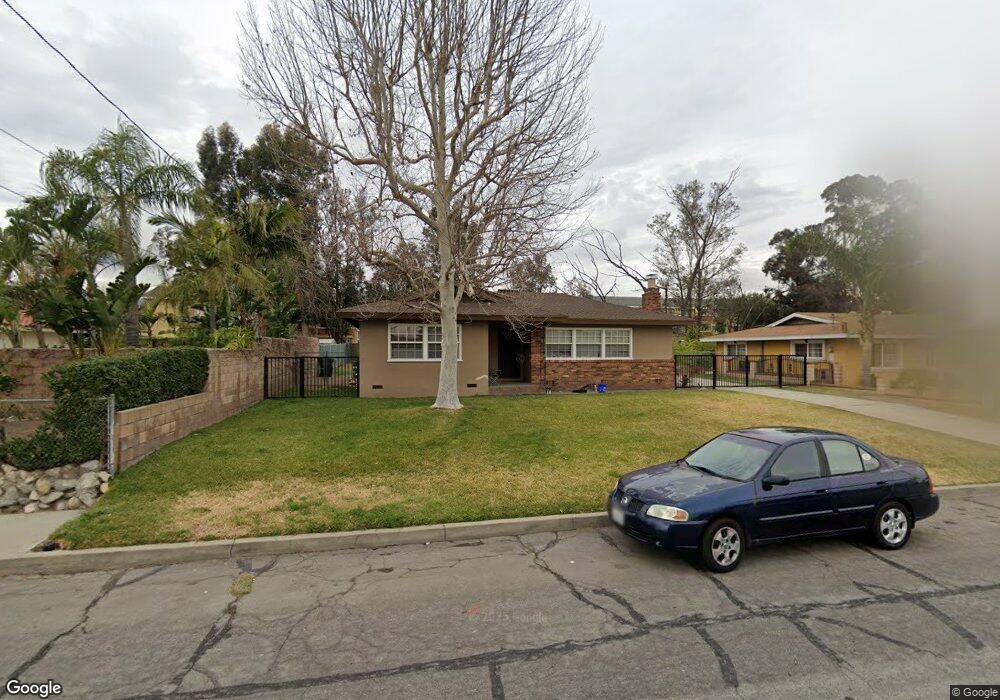
17336 Ivy Ave Fontana, CA 92335
Estimated Value: $430,000 - $552,000
1
Bed
2
Baths
1,252
Sq Ft
$398/Sq Ft
Est. Value
About This Home
This home is located at 17336 Ivy Ave, Fontana, CA 92335 and is currently estimated at $497,815, approximately $397 per square foot. 17336 Ivy Ave is a home located in San Bernardino County with nearby schools including South Tamarind Elementary School, Fontana Middle School, and Fontana High School.
Ownership History
Date
Name
Owned For
Owner Type
Purchase Details
Closed on
Aug 4, 2009
Sold by
Hsbc Bank Usa National Association
Bought by
Gadzhyan Toros and Gadzhyan Margarita A
Current Estimated Value
Purchase Details
Closed on
Jan 3, 2009
Sold by
Vera Guillermo
Bought by
Hsbc Bank Usa National Association
Purchase Details
Closed on
Mar 28, 2006
Sold by
Granillo Hector
Bought by
Vera Guillermo
Home Financials for this Owner
Home Financials are based on the most recent Mortgage that was taken out on this home.
Original Mortgage
$288,000
Interest Rate
6.5%
Mortgage Type
Purchase Money Mortgage
Purchase Details
Closed on
Mar 3, 2004
Sold by
Kessler John M
Bought by
Granillo Hector
Home Financials for this Owner
Home Financials are based on the most recent Mortgage that was taken out on this home.
Original Mortgage
$179,120
Interest Rate
5.5%
Mortgage Type
Purchase Money Mortgage
Create a Home Valuation Report for This Property
The Home Valuation Report is an in-depth analysis detailing your home's value as well as a comparison with similar homes in the area
Home Values in the Area
Average Home Value in this Area
Purchase History
| Date | Buyer | Sale Price | Title Company |
|---|---|---|---|
| Gadzhyan Toros | $90,000 | First American Title Company | |
| Hsbc Bank Usa National Association | $185,900 | Accommodation | |
| Vera Guillermo | $360,000 | First American Title | |
| Granillo Hector | $224,000 | Lawyers Title Company |
Source: Public Records
Mortgage History
| Date | Status | Borrower | Loan Amount |
|---|---|---|---|
| Previous Owner | Vera Guillermo | $288,000 | |
| Previous Owner | Granillo Hector | $179,120 | |
| Closed | Granillo Hector | $44,780 |
Source: Public Records
Tax History Compared to Growth
Tax History
| Year | Tax Paid | Tax Assessment Tax Assessment Total Assessment is a certain percentage of the fair market value that is determined by local assessors to be the total taxable value of land and additions on the property. | Land | Improvement |
|---|---|---|---|---|
| 2025 | $2,821 | $187,170 | $64,542 | $122,628 |
| 2024 | $2,821 | $183,500 | $63,276 | $120,224 |
| 2023 | $2,305 | $179,902 | $62,035 | $117,867 |
| 2022 | $2,279 | $176,375 | $60,819 | $115,556 |
| 2021 | $2,248 | $172,916 | $59,626 | $113,290 |
| 2020 | $2,229 | $171,143 | $59,015 | $112,128 |
| 2019 | $2,172 | $167,787 | $57,858 | $109,929 |
| 2018 | $2,182 | $164,498 | $56,724 | $107,774 |
| 2017 | $2,145 | $161,273 | $55,612 | $105,661 |
| 2016 | $2,089 | $158,111 | $54,522 | $103,589 |
| 2015 | $2,047 | $155,736 | $53,703 | $102,033 |
| 2014 | $2,035 | $152,685 | $52,651 | $100,034 |
Source: Public Records
Map
Nearby Homes
- 17394 Seville Ct
- 17334 Seville Ct
- 17392 Paine St
- 17655 Vine Ct
- 17196 Barbee St
- 17425 Arrow Blvd Unit 8
- 8019 Alder Ave
- 17562 Court St
- 7936 Alder Ave
- 18276 Arrow Blvd
- 17548 Court St
- 7738 Encinitas Ave
- 0 Sierra Ave Unit EV22072866
- 8575 Emerald Ave
- 7760 Blanchard Ave
- 17279 Miller Ave
- 17848 17858 Foothill Blvd
- 17626 Orange Ct
- 7740 Lombardy Ave
- 17232 Ceres Ave
- 17348 Ivy Ave
- 8215 Palmetto Ave
- 8205 Palmetto Ave
- 17360 Ivy Ave
- 17331 Ivy Ave
- 17341 Ivy Ave
- 17315 Ivy Ave
- 17351 Ivy Ave
- 17370 Ivy Ave
- 17361 Ivy Ave
- 8243 Palmetto Ave
- 17380 Ivy Ave
- 17369 Ivy Ave
- 17292 Ivy Ave
- 8253 Palmetto Ave
- 17332 Upland Ave
- 17342 Upland Ave
- 17388 Ivy Ave
- 17354 Upland Ave
- 17381 Ivy Ave