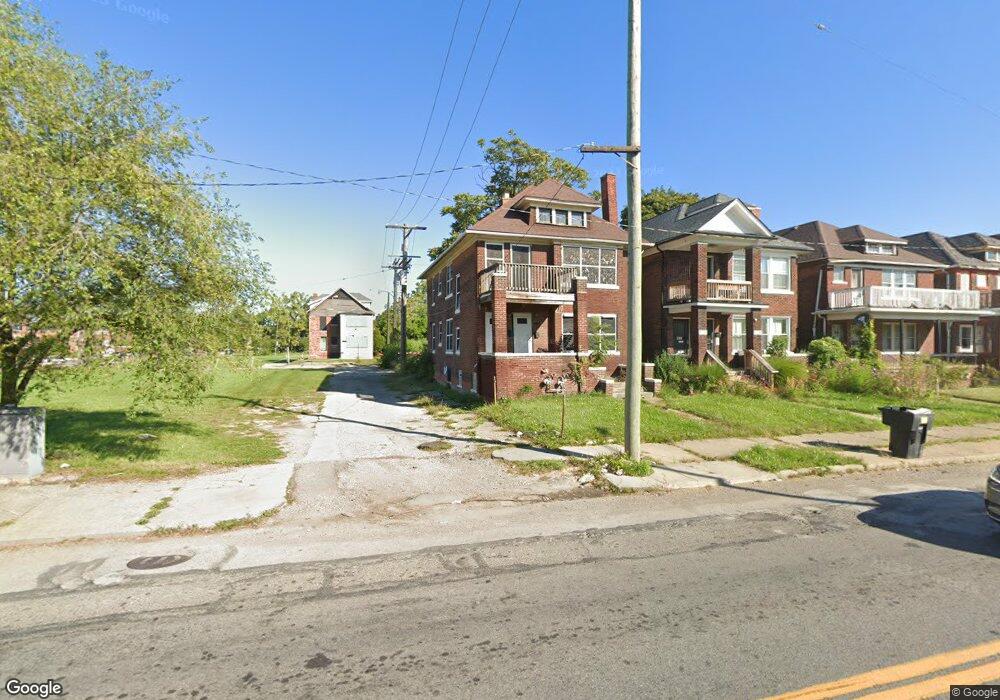
1734 Clairmount St Detroit, MI 48206
Boston Edison NeighborhoodEstimated Value: $75,000 - $138,000
4
Beds
2
Baths
2,182
Sq Ft
$48/Sq Ft
Est. Value
About This Home
This home is located at 1734 Clairmount St, Detroit, MI 48206 and is currently estimated at $103,833, approximately $47 per square foot. 1734 Clairmount St is a home located in Wayne County with nearby schools including Thirkell Elementary School, Charles L. Spain Elementary-Middle School, and Edward 'Duke' Ellington Conservatory of Music and Art.
Ownership History
Date
Name
Owned For
Owner Type
Purchase Details
Closed on
Jan 13, 2016
Sold by
Wayne County Treasurer
Bought by
Detroit Land Bank Authority
Current Estimated Value
Purchase Details
Closed on
Jan 15, 2013
Sold by
Jordan Real Estate Holdings Llc
Bought by
Handyman Ministries
Purchase Details
Closed on
Jan 26, 2012
Sold by
Jordan Rafic and Jordan Souad
Bought by
Jordan Real Estate Holding Company Llc
Purchase Details
Closed on
Jan 5, 2011
Sold by
Handy Kimberly
Bought by
Federal National Mortgage Association
Purchase Details
Closed on
Aug 18, 2004
Sold by
Argent Mortgage Co Llc
Bought by
Deutsche Bank National Trust Co and Argent Securities Inc Asset Backed Pass
Purchase Details
Closed on
Aug 11, 2004
Sold by
Nabors Aretha
Bought by
Argent Mortgage Co Llc
Purchase Details
Closed on
Dec 1, 2003
Sold by
Mckelton Antonio
Bought by
Nabors Aretha
Purchase Details
Closed on
Mar 26, 2003
Sold by
Ramsey Luther and Ramsey Ruby
Bought by
Mckelton Antonio
Create a Home Valuation Report for This Property
The Home Valuation Report is an in-depth analysis detailing your home's value as well as a comparison with similar homes in the area
Home Values in the Area
Average Home Value in this Area
Purchase History
| Date | Buyer | Sale Price | Title Company |
|---|---|---|---|
| Detroit Land Bank Authority | -- | None Available | |
| Handyman Ministries | -- | None Available | |
| Jordan Real Estate Holding Company Llc | -- | None Available | |
| Federal National Mortgage Association | $2,400 | None Available | |
| Deutsche Bank National Trust Co | -- | -- | |
| Argent Mortgage Co Llc | $73,424 | -- | |
| Nabors Aretha | $73,000 | Lawyers Title Ins | |
| Mckelton Antonio | $1,000 | -- |
Source: Public Records
Tax History
| Year | Tax Paid | Tax Assessment Tax Assessment Total Assessment is a certain percentage of the fair market value that is determined by local assessors to be the total taxable value of land and additions on the property. | Land | Improvement |
|---|---|---|---|---|
| 2025 | -- | $0 | $0 | $0 |
| 2024 | -- | $0 | $0 | $0 |
| 2023 | $0 | $0 | $0 | $0 |
| 2021 | $0 | $0 | $0 | $0 |
| 2020 | $0 | $0 | $0 | $0 |
| 2019 | $1,606 | $0 | $0 | $0 |
| 2018 | $0 | $0 | $0 | $0 |
| 2017 | $38 | $0 | $0 | $0 |
| 2016 | $340 | $0 | $0 | $0 |
| 2015 | $38 | $400 | $0 | $0 |
| 2013 | $1,293 | $12,928 | $0 | $0 |
| 2010 | -- | $18,524 | $363 | $18,161 |
Source: Public Records
Map
Nearby Homes
- 7701 Rosa Parks Blvd
- 1665 Atkinson St
- 1960 Taylor St
- 1977 Atkinson St
- 1667 Edison St
- 1983 Clairmount Ave
- 1975 Taylor St
- 2011 Atkinson St
- 1914 Edison St
- 2016 Atkinson St
- 2041 Atkinson St
- 1955 Hazelwood St
- 1714 Gladstone St
- 2057 Atkinson St
- 1525 Taylor St
- 1536 Hazelwood St
- 2066 Clairmount St
- 1525 Edison St
- 1644 Gladstone St
- 1517 Edison St
- 1734 Clairmount Ave
- 1728 Clairmount St
- 1722 Clairmount St
- 1716 Clairmount St
- 1710 Clairmount St
- 1704 Clairmount St
- 1741 Atkinson St
- 1731 Atkinson St
- 1731 Atkinson St Unit 1
- 1721 Atkinson #1 St
- 1698 Clairmount St
- 1735 Clairmount St
- 1735 Clairmount St Unit 1 or 2
- 1692 Clairmount St
- 1727 Clairmount St
- 9306 Rosa Parks Blvd
- 1723 Clairmount St
- 1721 Atkinson St
- 1721 Atkinson St Unit Lower
- 1721 Atkinson St Unit Upper
Your Personal Tour Guide
Ask me questions while you tour the home.