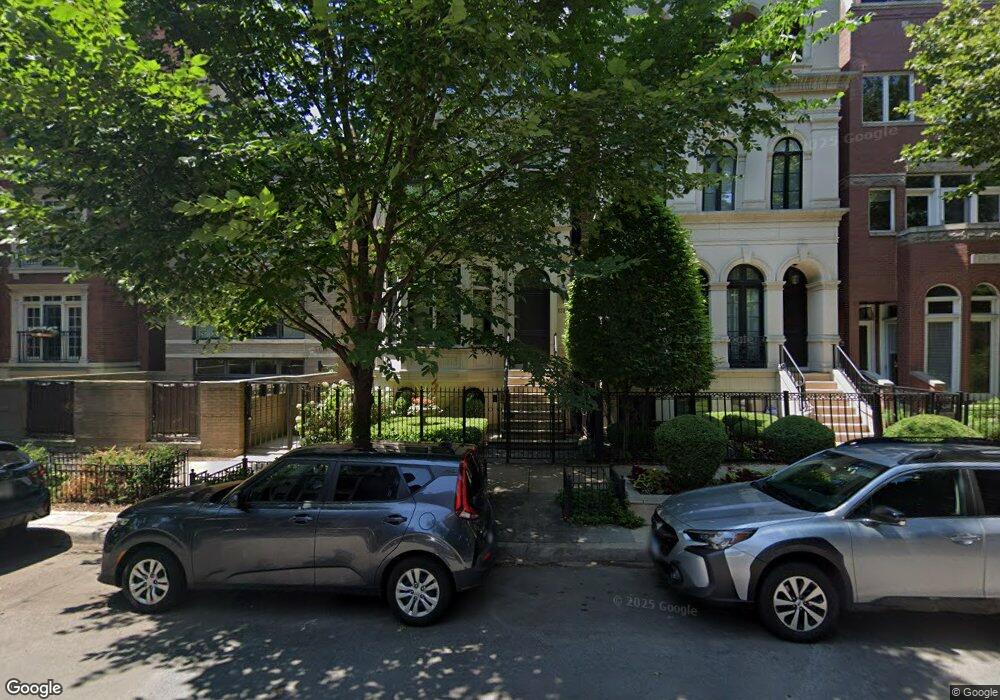
1734 N Mohawk St Unit 2 Chicago, IL 60614
Old Town NeighborhoodEstimated Value: $3,987,000 - $4,370,000
7
Beds
8
Baths
4,660
Sq Ft
$895/Sq Ft
Est. Value
About This Home
This home is located at 1734 N Mohawk St Unit 2, Chicago, IL 60614 and is currently estimated at $4,172,980, approximately $895 per square foot. 1734 N Mohawk St Unit 2 is a home located in Cook County with nearby schools including Abraham Lincoln Elementary School, Lincoln Park High School, and Immaculate Conception - St. Joseph School.
Ownership History
Date
Name
Owned For
Owner Type
Purchase Details
Closed on
Dec 19, 2017
Sold by
Chicago Residence Llc
Bought by
1734 North Mohawk Llc
Current Estimated Value
Home Financials for this Owner
Home Financials are based on the most recent Mortgage that was taken out on this home.
Original Mortgage
$1,750,000
Outstanding Balance
$1,424,625
Interest Rate
3%
Mortgage Type
Adjustable Rate Mortgage/ARM
Estimated Equity
$2,748,355
Purchase Details
Closed on
Jul 24, 2017
Sold by
Middlefork Development Llc
Bought by
Chicago Residence Llc
Home Financials for this Owner
Home Financials are based on the most recent Mortgage that was taken out on this home.
Original Mortgage
$1,750,000
Interest Rate
3%
Mortgage Type
Adjustable Rate Mortgage/ARM
Purchase Details
Closed on
Oct 23, 2013
Sold by
Rose Barbara Ann
Bought by
Middlefork Capital Llc 1734 N Mohawk
Create a Home Valuation Report for This Property
The Home Valuation Report is an in-depth analysis detailing your home's value as well as a comparison with similar homes in the area
Home Values in the Area
Average Home Value in this Area
Purchase History
| Date | Buyer | Sale Price | Title Company |
|---|---|---|---|
| 1734 North Mohawk Llc | -- | First American Title Insuran | |
| Chicago Residence Llc | $4,150,000 | First American Title | |
| Middlefork Capital Llc 1734 N Mohawk | $1,200,000 | Ct |
Source: Public Records
Mortgage History
| Date | Status | Borrower | Loan Amount |
|---|---|---|---|
| Open | 1734 North Mohawk Llc | $1,750,000 | |
| Previous Owner | Chicago Residence Llc | $1,750,000 |
Source: Public Records
Tax History
| Year | Tax Paid | Tax Assessment Tax Assessment Total Assessment is a certain percentage of the fair market value that is determined by local assessors to be the total taxable value of land and additions on the property. | Land | Improvement |
|---|---|---|---|---|
| 2025 | $73,037 | $376,000 | $45,384 | $330,616 |
| 2024 | $73,037 | $376,000 | $45,384 | $330,616 |
| 2023 | $71,200 | $346,164 | $36,600 | $309,564 |
| 2022 | $71,200 | $346,164 | $36,600 | $309,564 |
| 2021 | $69,610 | $346,164 | $36,600 | $309,564 |
| 2020 | $67,944 | $304,998 | $32,208 | $272,790 |
| 2019 | $66,606 | $331,520 | $32,208 | $299,312 |
| 2018 | $65,486 | $331,520 | $32,208 | $299,312 |
| 2017 | $42,318 | $196,579 | $26,352 | $170,227 |
| 2016 | $18,132 | $90,530 | $26,352 | $64,178 |
| 2015 | $4,829 | $26,352 | $26,352 | $0 |
| 2014 | $5,414 | $29,179 | $20,496 | $8,683 |
| 2013 | $2,975 | $63,914 | $20,496 | $43,418 |
Source: Public Records
Map
Nearby Homes
- 1755 N Mohawk St
- 1741 N Mohawk St
- 1720 N Mohawk St
- 1720 N Cleveland Ave
- 1849 N Mohawk St Unit 2
- 1849 N Mohawk St Unit 1
- 1910 N Larrabee St Unit 1910
- 1706 N Fern Ct
- 1718 N Sedgwick St
- 1606 N Mohawk St Unit B
- 415 W Eugenie St
- 1646 N Orchard St Unit 2
- 1853 N Burling St
- 1865 N Burling St
- 1938 N Hudson Ave
- 1942 N Orchard St Unit 3N
- 1942 N Orchard St Unit 2
- 1719 N Halsted St Unit B
- 1845 N Halsted St Unit B
- 1807 N Orleans St Unit 1S
- 1734 N Mohawk St
- 1736 N Mohawk St
- 1732 N Mohawk St Unit C
- 1732 N Mohawk St Unit B
- 1732 N Mohawk St Unit A
- 1732 N Mohawk St Unit A
- 1738 N Mohawk St Unit 3
- 1738 N Mohawk St Unit 2
- 1738 N Mohawk St Unit 1
- 1738 N Mohawk St
- 1726 N Mohawk St Unit 3N
- 1726 N Mohawk St Unit 2N
- 1726 N Mohawk St Unit 1N
- 1726 N Mohawk St Unit 1S
- 1726 N Mohawk St Unit 2S
- 1740 N Mohawk St
- 1724 N Mohawk St Unit 3
- 1724 N Mohawk St Unit PH
- 1722 N Mohawk St
- 1722 N Mohawk St Unit 3F
Your Personal Tour Guide
Ask me questions while you tour the home.