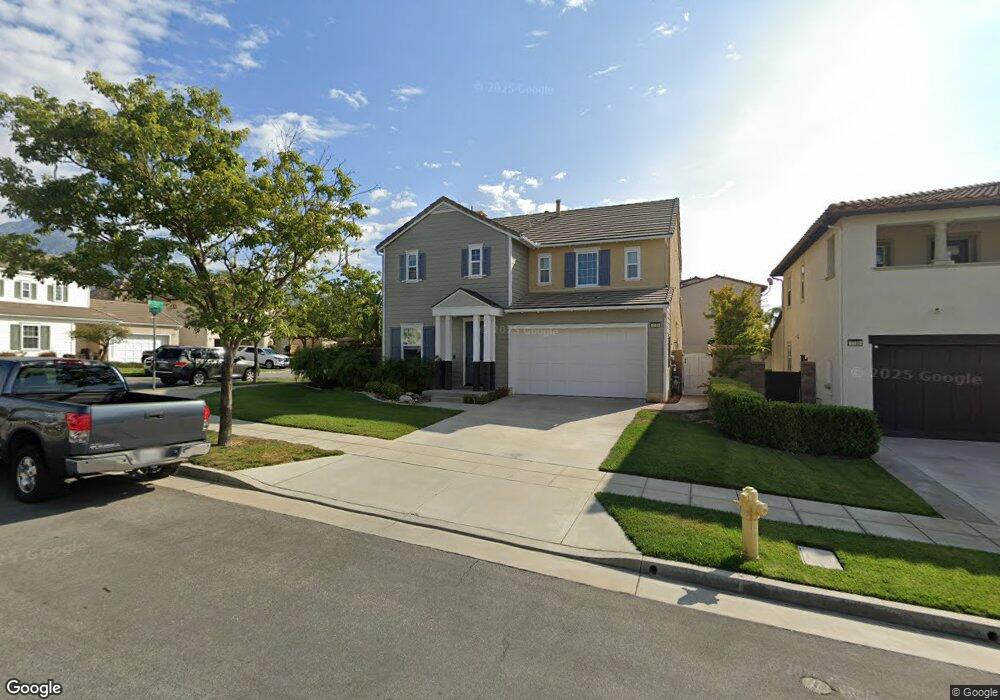
1734 Swan Loop W Upland, CA 91784
Estimated Value: $913,000 - $967,701
4
Beds
3
Baths
2,422
Sq Ft
$392/Sq Ft
Est. Value
About This Home
This home is located at 1734 Swan Loop W, Upland, CA 91784 and is currently estimated at $950,425, approximately $392 per square foot. 1734 Swan Loop W is a home located in San Bernardino County with nearby schools including Foothill Knolls STEM Academy of Innovation, Upland High School, and St. Joseph Elementary School.
Ownership History
Date
Name
Owned For
Owner Type
Purchase Details
Closed on
May 22, 2013
Sold by
Ruelas Marlin J
Bought by
Ruelas Family Trust
Current Estimated Value
Purchase Details
Closed on
Nov 10, 2008
Sold by
Dela Cruz Eldridge Dizon
Bought by
Ruelas Marlin J and Ruelas Tracy M
Home Financials for this Owner
Home Financials are based on the most recent Mortgage that was taken out on this home.
Original Mortgage
$409,594
Outstanding Balance
$266,464
Interest Rate
5.9%
Mortgage Type
FHA
Estimated Equity
$683,961
Purchase Details
Closed on
Oct 20, 2006
Sold by
Taylor Woodrow Homes Inc
Bought by
Delacruz Eldridge D and Delacruz Javina May
Home Financials for this Owner
Home Financials are based on the most recent Mortgage that was taken out on this home.
Original Mortgage
$507,376
Interest Rate
7.25%
Mortgage Type
New Conventional
Create a Home Valuation Report for This Property
The Home Valuation Report is an in-depth analysis detailing your home's value as well as a comparison with similar homes in the area
Home Values in the Area
Average Home Value in this Area
Purchase History
| Date | Buyer | Sale Price | Title Company |
|---|---|---|---|
| Ruelas Family Trust | -- | None Available | |
| Ruelas Marlin J | $415,000 | Southland Title Co | |
| Delacruz Eldridge D | $634,500 | Fidelity National Title Co |
Source: Public Records
Mortgage History
| Date | Status | Borrower | Loan Amount |
|---|---|---|---|
| Open | Ruelas Marlin J | $409,594 | |
| Previous Owner | Delacruz Eldridge D | $507,376 |
Source: Public Records
Tax History
| Year | Tax Paid | Tax Assessment Tax Assessment Total Assessment is a certain percentage of the fair market value that is determined by local assessors to be the total taxable value of land and additions on the property. | Land | Improvement |
|---|---|---|---|---|
| 2025 | $8,986 | $534,425 | $187,049 | $347,376 |
| 2024 | $8,687 | $523,946 | $183,381 | $340,565 |
| 2023 | $8,518 | $513,672 | $179,785 | $333,887 |
| 2022 | $8,902 | $503,600 | $176,260 | $327,340 |
| 2021 | $8,733 | $493,726 | $172,804 | $320,922 |
| 2020 | $8,405 | $488,663 | $171,032 | $317,631 |
| 2019 | $8,376 | $479,081 | $167,678 | $311,403 |
| 2018 | $8,140 | $469,687 | $164,390 | $305,297 |
| 2017 | $7,741 | $460,478 | $161,167 | $299,311 |
| 2016 | $7,527 | $451,449 | $158,007 | $293,442 |
| 2015 | $7,417 | $444,668 | $155,634 | $289,034 |
| 2014 | $7,295 | $435,957 | $152,585 | $283,372 |
Source: Public Records
Map
Nearby Homes
- 1409 Upland Hills Dr N Unit N
- 1238 Leggio Ln
- 1060 Pebble Beach Dr Unit 58
- 1015 Pebble Beach Dr
- 1842 Richards Place
- 1589 Bison St
- 1267 Kendra Ln
- 1855 Old Baldy Way
- 1182 Upland Hills Dr S
- 1631 Quail St
- 1535 Upland Hills Dr S
- 1568 N La Quinta Dr
- 7212 Rancho Rosa Way
- 1661 Danbrook Place
- 7041 Cameo St
- 8510 Monte Vista St
- 1382 Crawford Ave
- 1420 Felicita Ct
- 655 Doreen Ct
- 8682 La Grande St
- 1730 Swan Loop W
- 1314 Cole Ln
- 1320 Cole Ln
- 1305 Cole Ln
- 1309 Swan Loop S
- 1311 Cole Ln
- 1737 Swan Loop W
- 1731 Swan Loop W
- 1741 Swan Loop W
- 1317 Cole Ln
- 1315 Swan Loop S
- 1326 Cole Ln
- 1727 Swan Loop W
- 1745 Swan Loop W
- 1323 Cole Ln
- 1321 Swan Loop S
- 1723 Swan Loop W
- 1332 Cole Ln
- 1734 Dosh Way
- 1329 Cole Ln
Your Personal Tour Guide
Ask me questions while you tour the home.