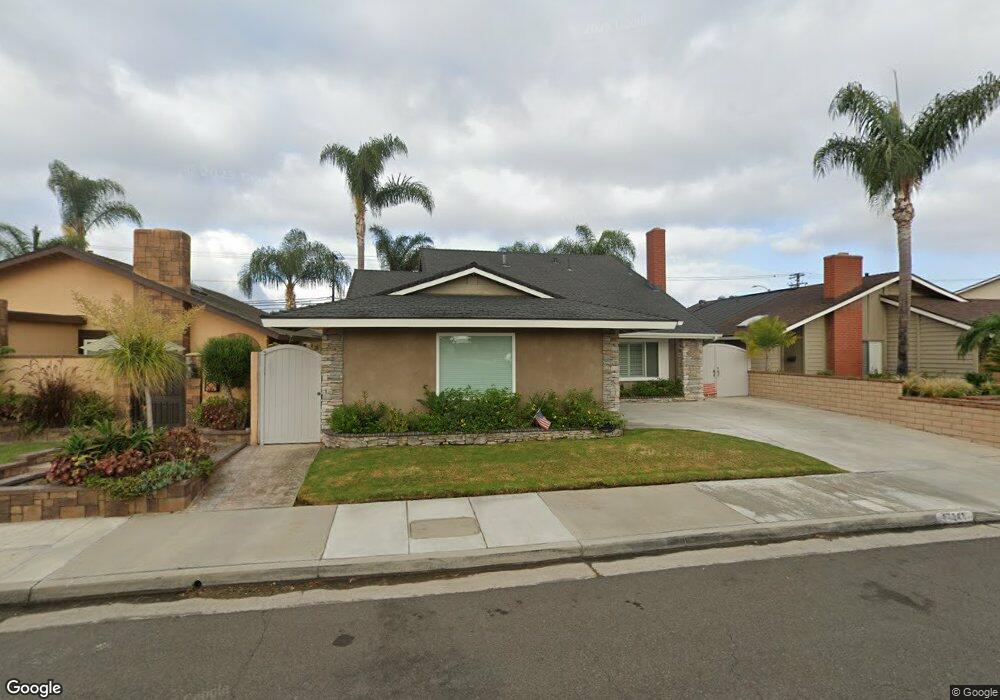
17341 Kristopher Ln Huntington Beach, CA 92647
Estimated Value: $1,279,596 - $1,415,000
3
Beds
2
Baths
1,596
Sq Ft
$843/Sq Ft
Est. Value
About This Home
This home is located at 17341 Kristopher Ln, Huntington Beach, CA 92647 and is currently estimated at $1,345,649, approximately $843 per square foot. 17341 Kristopher Ln is a home located in Orange County with nearby schools including Golden View Elementary School - Environmental Science School, Mesa View Middle School, and Ocean View High.
Ownership History
Date
Name
Owned For
Owner Type
Purchase Details
Closed on
Dec 17, 2004
Sold by
Wallace Richard
Bought by
Wallace Richard and Wallace Kelly
Current Estimated Value
Home Financials for this Owner
Home Financials are based on the most recent Mortgage that was taken out on this home.
Original Mortgage
$450,000
Interest Rate
5.74%
Mortgage Type
New Conventional
Purchase Details
Closed on
Oct 31, 1997
Sold by
Payne Richard S and Payne Theresa Michele
Bought by
Wallace Richard
Home Financials for this Owner
Home Financials are based on the most recent Mortgage that was taken out on this home.
Original Mortgage
$201,195
Interest Rate
9.87%
Purchase Details
Closed on
Aug 30, 1994
Sold by
Payne Richard and Payne Brian Christopher
Bought by
Payne Brian Christopher
Purchase Details
Closed on
Aug 16, 1994
Sold by
Payne Brian Christopher
Bought by
Payne Richard
Create a Home Valuation Report for This Property
The Home Valuation Report is an in-depth analysis detailing your home's value as well as a comparison with similar homes in the area
Home Values in the Area
Average Home Value in this Area
Purchase History
| Date | Buyer | Sale Price | Title Company |
|---|---|---|---|
| Wallace Richard | -- | Homeconnects Title | |
| Wallace Richard | $237,000 | Stewart Title | |
| Payne Brian Christopher | -- | -- | |
| Payne Richard | -- | -- |
Source: Public Records
Mortgage History
| Date | Status | Borrower | Loan Amount |
|---|---|---|---|
| Closed | Wallace Richard | $450,000 | |
| Previous Owner | Wallace Richard | $201,195 | |
| Closed | Wallace Richard | $7,500 |
Source: Public Records
Tax History Compared to Growth
Tax History
| Year | Tax Paid | Tax Assessment Tax Assessment Total Assessment is a certain percentage of the fair market value that is determined by local assessors to be the total taxable value of land and additions on the property. | Land | Improvement |
|---|---|---|---|---|
| 2025 | $4,787 | $416,540 | $267,062 | $149,478 |
| 2024 | $4,787 | $408,373 | $261,825 | $146,548 |
| 2023 | $4,676 | $400,366 | $256,691 | $143,675 |
| 2022 | $4,604 | $392,516 | $251,658 | $140,858 |
| 2021 | $4,520 | $384,820 | $246,723 | $138,097 |
| 2020 | $4,469 | $380,875 | $244,194 | $136,681 |
| 2019 | $4,392 | $373,407 | $239,406 | $134,001 |
| 2018 | $4,293 | $366,086 | $234,712 | $131,374 |
| 2017 | $4,224 | $358,908 | $230,109 | $128,799 |
| 2016 | $4,053 | $351,871 | $225,597 | $126,274 |
| 2015 | $3,991 | $346,586 | $222,208 | $124,378 |
| 2014 | $3,911 | $339,797 | $217,855 | $121,942 |
Source: Public Records
Map
Nearby Homes
- 6600 Warner Ave Unit 119
- 6600 Warner Ave Unit 50
- 6600 Warner Ave
- 6600 Warner Ave Unit 144
- 6600 Warner Ave Unit 142
- 6672 Sun Dr Unit B
- 6301 Warner Ave Unit 40
- 6301 Warner Ave Unit 88
- 6852 Jardines Dr
- 17071 Pinehurst Ln
- 16892 Limelight Cir Unit B
- 6051 Summerdale Dr
- 6241 Warner Ave Unit 108
- 17372 Forbes Ln
- 6582 Corrine Cir
- 17261 Gothard St Unit 50
- 17261 Gothard St Unit 67
- 17261 Gothard St Unit 63
- 17261 Gothard St Unit 64
- 5812 Raphael Dr
- 17351 Kristopher Ln
- 17331 Kristopher Ln
- 17371 Kristopher Ln
- 17321 Kristopher Ln
- 6532 Kirklund Cir
- 6531 Kirklund Cir
- 17311 Kristopher Ln
- 17381 Kristopher Ln
- 17362 Madera Ln
- 17372 Madera Ln
- 6552 Kirklund Cir
- 6541 Kirklund Cir
- 17332 Madera Ln
- 17342 Madera Ln
- 6531 Shenlyn Dr
- 6532 Rennrick Cir
- 17382 Madera Ln
- 17301 Kristopher Ln
- 17322 Madera Ln
- 6562 Kirklund Cir