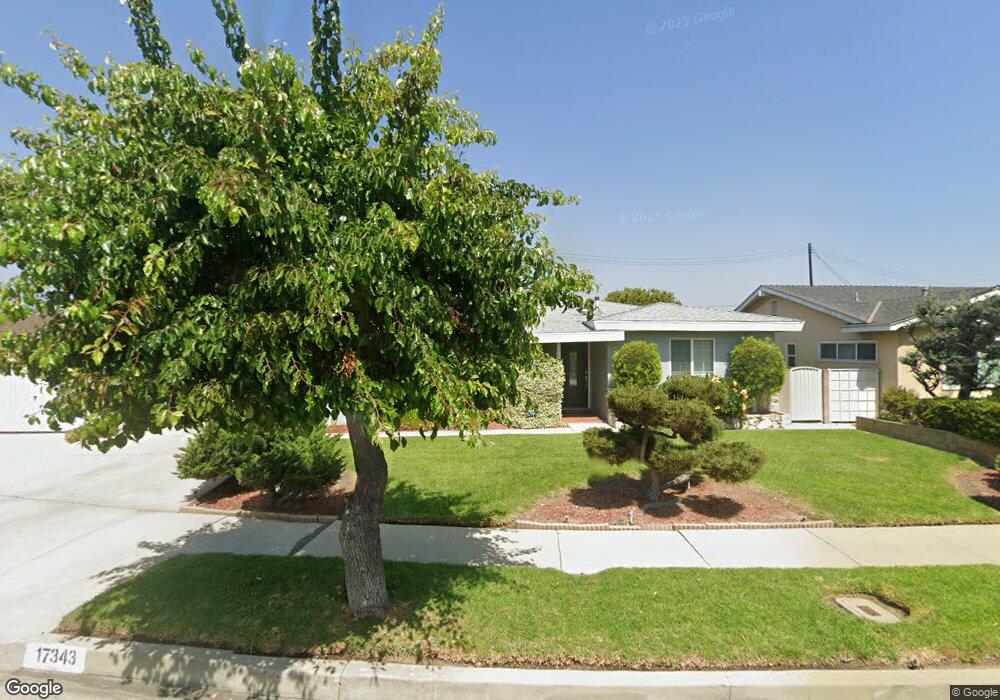
17343 S Hoover St Gardena, CA 90247
Harbor Gateway NeighborhoodEstimated Value: $841,000 - $910,000
3
Beds
2
Baths
1,395
Sq Ft
$622/Sq Ft
Est. Value
About This Home
This home is located at 17343 S Hoover St, Gardena, CA 90247 and is currently estimated at $868,005, approximately $622 per square foot. 17343 S Hoover St is a home located in Los Angeles County with nearby schools including Gardena Elementary School, Robert E. Peary Middle School, and Gardena Senior High School.
Ownership History
Date
Name
Owned For
Owner Type
Purchase Details
Closed on
Aug 11, 2016
Sold by
Wauls Paula M and Brooks Bernis B
Bought by
Wauls Paula M
Current Estimated Value
Home Financials for this Owner
Home Financials are based on the most recent Mortgage that was taken out on this home.
Original Mortgage
$398,860
Outstanding Balance
$317,109
Interest Rate
3.37%
Mortgage Type
FHA
Estimated Equity
$550,896
Purchase Details
Closed on
Jul 30, 2001
Sold by
Hunt H Fred and Hunt Debora L
Bought by
Wauls Paula M
Home Financials for this Owner
Home Financials are based on the most recent Mortgage that was taken out on this home.
Original Mortgage
$167,200
Interest Rate
7.5%
Purchase Details
Closed on
Nov 15, 1995
Sold by
Lee Daniel and Lee Glenda
Bought by
Hunt H Fred and Hunt Debora L
Home Financials for this Owner
Home Financials are based on the most recent Mortgage that was taken out on this home.
Original Mortgage
$151,023
Interest Rate
7.37%
Mortgage Type
FHA
Create a Home Valuation Report for This Property
The Home Valuation Report is an in-depth analysis detailing your home's value as well as a comparison with similar homes in the area
Home Values in the Area
Average Home Value in this Area
Purchase History
| Date | Buyer | Sale Price | Title Company |
|---|---|---|---|
| Wauls Paula M | -- | Ortc | |
| Wauls Paula M | $209,000 | South Coast Title | |
| Hunt H Fred | $154,000 | -- |
Source: Public Records
Mortgage History
| Date | Status | Borrower | Loan Amount |
|---|---|---|---|
| Open | Wauls Paula M | $398,860 | |
| Closed | Wauls Paula M | $167,200 | |
| Previous Owner | Hunt H Fred | $151,023 | |
| Closed | Wauls Paula M | $41,800 |
Source: Public Records
Tax History Compared to Growth
Tax History
| Year | Tax Paid | Tax Assessment Tax Assessment Total Assessment is a certain percentage of the fair market value that is determined by local assessors to be the total taxable value of land and additions on the property. | Land | Improvement |
|---|---|---|---|---|
| 2025 | $4,020 | $308,731 | $246,991 | $61,740 |
| 2024 | $4,020 | $302,679 | $242,149 | $60,530 |
| 2023 | $3,944 | $296,745 | $237,401 | $59,344 |
| 2022 | $3,768 | $290,928 | $232,747 | $58,181 |
| 2021 | $3,714 | $285,225 | $228,184 | $57,041 |
| 2019 | $3,605 | $276,767 | $221,417 | $55,350 |
| 2018 | $3,533 | $271,341 | $217,076 | $54,265 |
| 2016 | $3,364 | $260,806 | $208,648 | $52,158 |
| 2015 | $3,313 | $256,889 | $205,514 | $51,375 |
| 2014 | $3,324 | $251,858 | $201,489 | $50,369 |
Source: Public Records
Map
Nearby Homes
- 710 W 172nd St
- 17002 S Catalina Ave
- 17035 S Catalina Ave
- 527 W 169th St
- 16828 S Budlong Ave
- 16701 S Denver Ave
- 16619 S Denver Ave
- 762 W Gardena Blvd
- 1040 W 165th Place
- 1213 W 168th St Unit C
- 16911 S Raymond Place
- 18114 S Budlong Ave
- 16928 S Broadway
- 1119 Electric St
- 16122 S Denver Ave
- 1419 W 179th St Unit 22
- 1419 W 179th St Unit 3
- 16101 S Figueroa St
- 1308 W 163rd St Unit 1
- 16001 S Vermont Ave Unit 60
- 17339 S Hoover St
- 17308 Merit Ave
- 17332 Merit Ave
- 17333 S Hoover St
- 17346 S Hoover St
- 17350 S Hoover St
- 17342 S Hoover St
- 17354 S Hoover St
- 17301 Merit Ave
- 17327 S Hoover St
- 17338 S Hoover St
- 17358 S Hoover St
- 17305 Merit Ave
- 17311 Merit Ave
- 17332 S Hoover St
- 17315 Merit Ave
- 702 W 173rd Place
- 17321 S Hoover St
- 711 W 173rd Place
- 17326 S Hoover St