1735 Doxey St Ogden, UT 84403
Mount Ogden NeighborhoodEstimated Value: $495,000 - $524,398
About This Home
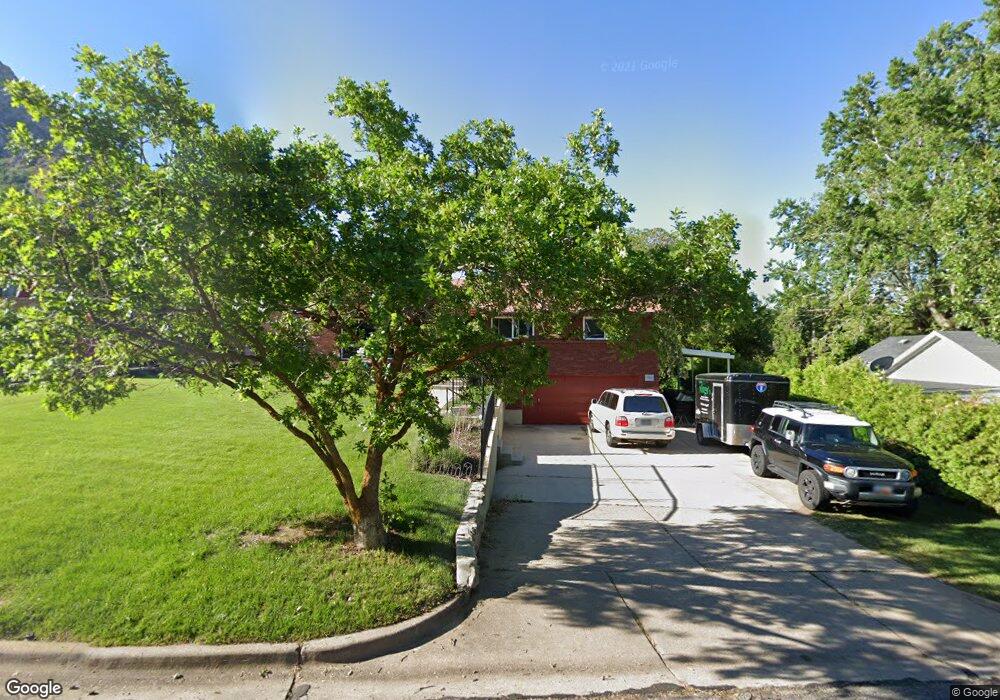
This home is located at 1735 Doxey St, Ogden, UT 84403 and is currently estimated at $512,350, approximately $237 per square foot. 1735 Doxey St is a home located in Weber County with nearby schools including Polk School, Mount Ogden Junior High School, and Ogden High School.
Ownership History
We collect this data history from publicly available records. To have your information removed, we recommend requesting removal directly through your county’s website.
Purchase Details
Home Financials for this Owner
Home Financials are based on the most recent Mortgage that was taken out on this home.Purchase Details
Home Financials for this Owner
Home Financials are based on the most recent Mortgage that was taken out on this home.Purchase Details
Home Values in the Area
Average Home Value in this Area
Purchase History
We collect this data history from publicly available records. To have your information removed, we recommend requesting removal directly through your county’s website.
| Date | Buyer | Sale Price | Title Company |
|---|---|---|---|
| -- | Lincoln Title | ||
| -- | Backman Title Services Ltd | ||
| -- | None Available |
Mortgage History
We collect this data history from publicly available records. To have your information removed, we recommend requesting removal directly through your county’s website.
| Date | Status | Borrower | Loan Amount |
|---|---|---|---|
| Open | $498,750 | ||
| Previous Owner | $142,400 |
Tax History
We collect this data history from publicly available records. To have your information removed, we recommend requesting removal directly through your county’s website.
| Year | Tax Paid | Tax Assessment Tax Assessment Total Assessment is a certain percentage of the fair market value that is determined by local assessors to be the total taxable value of land and additions on the property. | Land | Improvement |
|---|---|---|---|---|
| 2025 | $3,726 | $490,005 | $164,582 | $325,423 |
| 2024 | $3,695 | $479,000 | $164,582 | $314,418 |
| 2023 | $3,595 | $472,000 | $157,980 | $314,020 |
| 2022 | $3,604 | $479,000 | $139,752 | $339,248 |
| 2021 | $3,121 | $374,000 | $74,644 | $299,356 |
| 2020 | $2,840 | $312,000 | $57,436 | $254,564 |
| 2019 | $2,780 | $286,000 | $54,332 | $231,668 |
| 2018 | $2,544 | $258,000 | $54,332 | $203,668 |
| 2017 | $2,214 | $206,000 | $54,332 | $151,668 |
| 2016 | $1,983 | $98,368 | $23,493 | $74,875 |
| 2015 | $1,972 | $95,782 | $23,493 | $72,289 |
| 2014 | $1,918 | $91,927 | $23,493 | $68,434 |
Map
- 1785 29th St Unit 308
- 1785 29th St Unit 208
- 2890 Wheelock Ave
- 1660 26th St
- 1549 Binford St
- 1715 Darling St Unit 3
- 1571 Lake St
- 1471 26th St
- 1443 Binford St
- 1504 Lake St
- 1421 Binford St
- 1702 Capitol St
- 2805 Polk Ave
- 1362 Marilyn Dr
- 2572 Polk Ave
- 1544 Capitol St
- 2571 Polk Ave
- 1402 Capitol St
- 1260 28th St
- 2304 Fillmore Ave
Ask me questions while you tour the home.