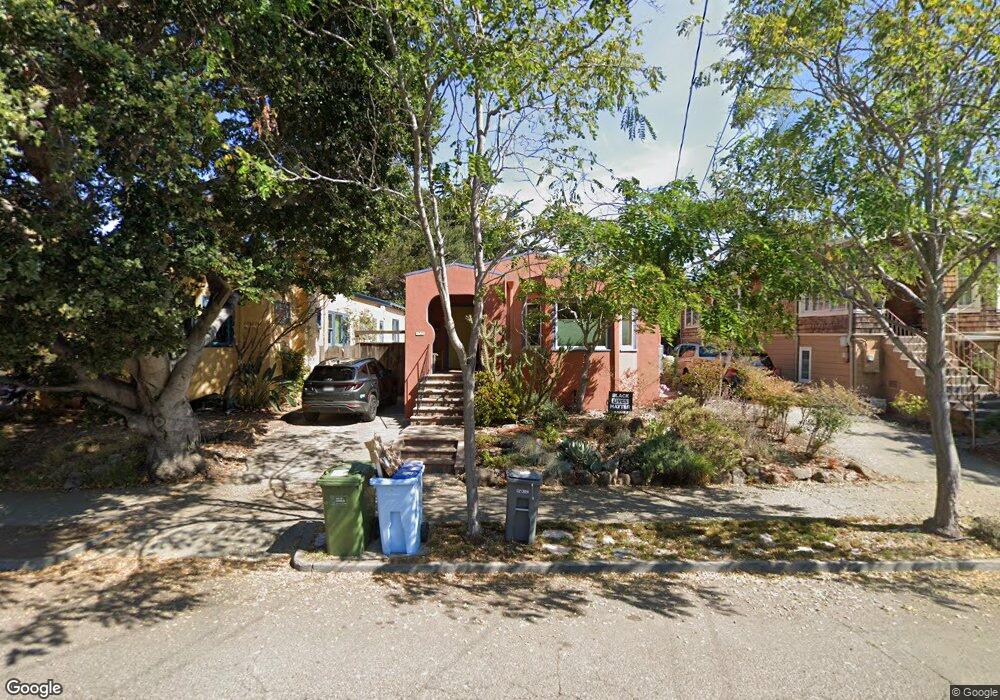
1735 Stuart St Berkeley, CA 94703
South Berkeley NeighborhoodEstimated Value: $1,013,000 - $1,467,000
2
Beds
2
Baths
1,397
Sq Ft
$874/Sq Ft
Est. Value
About This Home
This home is located at 1735 Stuart St, Berkeley, CA 94703 and is currently estimated at $1,220,363, approximately $873 per square foot. 1735 Stuart St is a home located in Alameda County with nearby schools including Malcolm X Elementary School, Emerson Elementary School, and John Muir Elementary School.
Ownership History
Date
Name
Owned For
Owner Type
Purchase Details
Closed on
Feb 14, 2018
Sold by
Nahman Albert R and Hammer Marjorie S
Bought by
Nahman Albert R and Hammer Marjorie S
Current Estimated Value
Create a Home Valuation Report for This Property
The Home Valuation Report is an in-depth analysis detailing your home's value as well as a comparison with similar homes in the area
Home Values in the Area
Average Home Value in this Area
Purchase History
| Date | Buyer | Sale Price | Title Company |
|---|---|---|---|
| Nahman Albert R | -- | None Available |
Source: Public Records
Tax History
| Year | Tax Paid | Tax Assessment Tax Assessment Total Assessment is a certain percentage of the fair market value that is determined by local assessors to be the total taxable value of land and additions on the property. | Land | Improvement |
|---|---|---|---|---|
| 2025 | $5,654 | $204,506 | $58,569 | $152,937 |
| 2024 | $5,654 | $200,360 | $57,421 | $149,939 |
| 2023 | $5,453 | $203,294 | $56,295 | $146,999 |
| 2022 | $5,248 | $192,308 | $55,191 | $144,117 |
| 2021 | $5,225 | $188,400 | $54,109 | $141,291 |
| 2020 | $4,884 | $193,397 | $53,554 | $139,843 |
| 2019 | $4,611 | $189,605 | $52,504 | $137,101 |
| 2018 | $4,494 | $185,888 | $51,475 | $134,413 |
| 2017 | $4,307 | $182,244 | $50,466 | $131,778 |
| 2016 | $4,094 | $178,670 | $49,476 | $129,194 |
| 2015 | $4,019 | $175,987 | $48,733 | $127,254 |
| 2014 | $3,903 | $172,540 | $47,779 | $124,761 |
Source: Public Records
Map
Nearby Homes
- 2701 Grant St
- 1612 Carleton St
- 2926 Ellis St
- 1612 Parker St
- 1530 Stuart St
- 1901 Parker St Unit 3
- 1515 Derby St
- 1535 Julia St
- 1646 Ashby Ave
- 2750 Sacramento St
- 2758 Sacramento St
- 2774 Sacramento St
- 2782 Sacramento St
- 2790 Sacramento St
- 1450 Ward St
- 1645 Dwight Way
- 2018 Blake St
- 2057 Emerson St
- 2922 Stanton St
- 2110 Ashby Ave
Your Personal Tour Guide
Ask me questions while you tour the home.