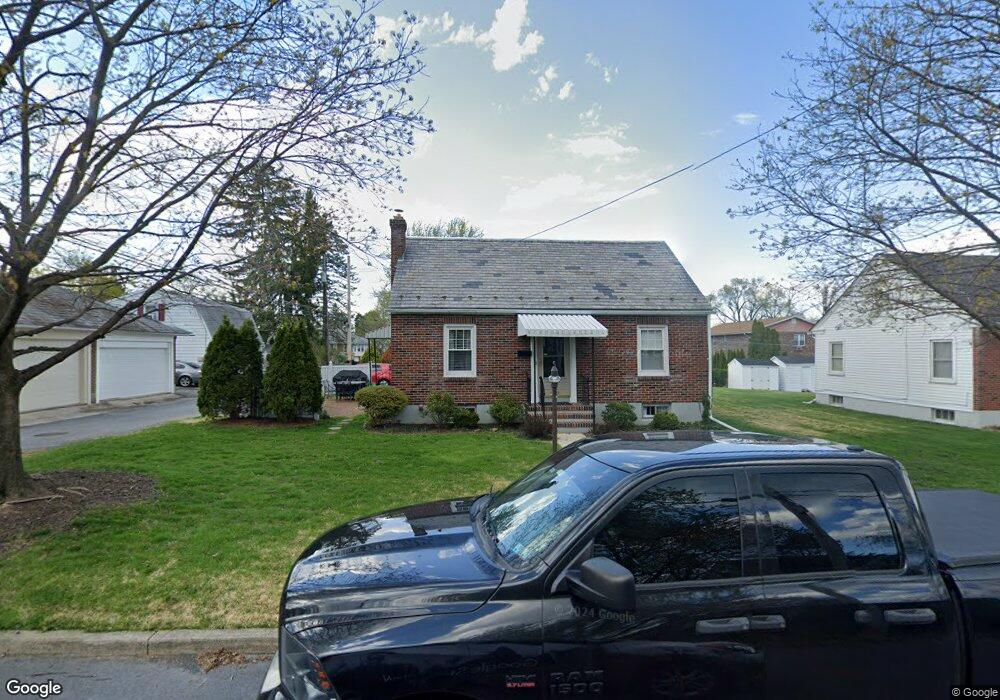
1735 W Congress St Unit 1739 Allentown, PA 18104
West End Allentown NeighborhoodEstimated Value: $267,000 - $294,000
3
Beds
1
Bath
930
Sq Ft
$302/Sq Ft
Est. Value
About This Home
This home is located at 1735 W Congress St Unit 1739, Allentown, PA 18104 and is currently estimated at $280,801, approximately $301 per square foot. 1735 W Congress St Unit 1739 is a home located in Lehigh County with nearby schools including Muhlenberg Elementary School, San Rafael Junior High School, and Trexler Middle School.
Ownership History
Date
Name
Owned For
Owner Type
Purchase Details
Closed on
Apr 30, 2021
Sold by
Nguyen Duy and Ortiz Julio C
Bought by
Wannemacher Bradley and Wannemacher Regina
Current Estimated Value
Home Financials for this Owner
Home Financials are based on the most recent Mortgage that was taken out on this home.
Original Mortgage
$164,000
Outstanding Balance
$148,393
Interest Rate
3%
Mortgage Type
New Conventional
Estimated Equity
$132,408
Purchase Details
Closed on
Mar 8, 2021
Sold by
Snyder Marlane I
Bought by
Nguyen Duy and Ortiz Julio C
Home Financials for this Owner
Home Financials are based on the most recent Mortgage that was taken out on this home.
Original Mortgage
$164,000
Outstanding Balance
$148,393
Interest Rate
3%
Mortgage Type
New Conventional
Estimated Equity
$132,408
Purchase Details
Closed on
Jul 10, 1989
Sold by
Lavenburg Warren R and Lavenburg Jeanette A
Bought by
Lavenburg Jeanette A and Lavenburg Lavenbur C
Create a Home Valuation Report for This Property
The Home Valuation Report is an in-depth analysis detailing your home's value as well as a comparison with similar homes in the area
Home Values in the Area
Average Home Value in this Area
Purchase History
| Date | Buyer | Sale Price | Title Company |
|---|---|---|---|
| Wannemacher Bradley | $205,000 | Parkland Abstract Corp | |
| Nguyen Duy | $105,000 | Parkland Abstract Corp | |
| Lavenburg Jeanette A | -- | -- |
Source: Public Records
Mortgage History
| Date | Status | Borrower | Loan Amount |
|---|---|---|---|
| Open | Wannemacher Bradley | $164,000 |
Source: Public Records
Tax History Compared to Growth
Tax History
| Year | Tax Paid | Tax Assessment Tax Assessment Total Assessment is a certain percentage of the fair market value that is determined by local assessors to be the total taxable value of land and additions on the property. | Land | Improvement |
|---|---|---|---|---|
| 2025 | $3,620 | $101,300 | $25,800 | $75,500 |
| 2024 | $3,620 | $101,300 | $25,800 | $75,500 |
| 2023 | $3,620 | $101,300 | $25,800 | $75,500 |
| 2022 | $3,505 | $101,300 | $75,500 | $25,800 |
| 2021 | $3,441 | $101,300 | $25,800 | $75,500 |
| 2020 | $3,360 | $101,300 | $25,800 | $75,500 |
| 2019 | $3,311 | $101,300 | $25,800 | $75,500 |
| 2018 | $3,044 | $101,300 | $25,800 | $75,500 |
| 2017 | $2,973 | $101,300 | $25,800 | $75,500 |
| 2016 | -- | $101,300 | $25,800 | $75,500 |
| 2015 | -- | $101,300 | $25,800 | $75,500 |
| 2014 | -- | $101,300 | $25,800 | $75,500 |
Source: Public Records
Map
Nearby Homes
- 1613 W Congress St Unit 1619
- 1243 N 19th St
- 2014 W Highland St
- 1717 W Cedar St
- 1017 N 21st St
- 1802 W Washington St
- 1417 W Woodlawn St Unit 1431
- 2023 W Washington St
- 1718 W Stanley St Unit 1722
- 2150 W Livingston St
- 1246 N 22nd St
- 1818 W Jane St
- 638 N 16th St
- 1135 N 23rd St
- 1009 N 13th St
- 1235 Livingston St
- 605 N 16th St
- 605 1/2 N 16th St
- 519 N Saint George St
- 518 N Saint George St
- 1731 W Congress St
- 1727 W Congress St Unit 1733
- 1131 N 18th St
- 1137 N 18th St
- 1127 N 18th St Unit 1129
- 1129 N 18th St
- 1738 W Pennsylvania St
- 1723 W Congress St
- 1740 W Pennsylvania St
- 1721 W Congress St Unit 1725
- 1139 N 18th St Unit 1143
- 1730 W Pennsylvania St Unit 1736
- 1141 N 18th St
- 1734 W Congress St
- 1119 N 18th St Unit 1125
- 1145 N 18th St Unit 1151
- 1722 W Congress St Unit 1730
- 1113 N 18th St Unit 1117
- 1714 W Congress St Unit 1720
- 1130 N 18th St