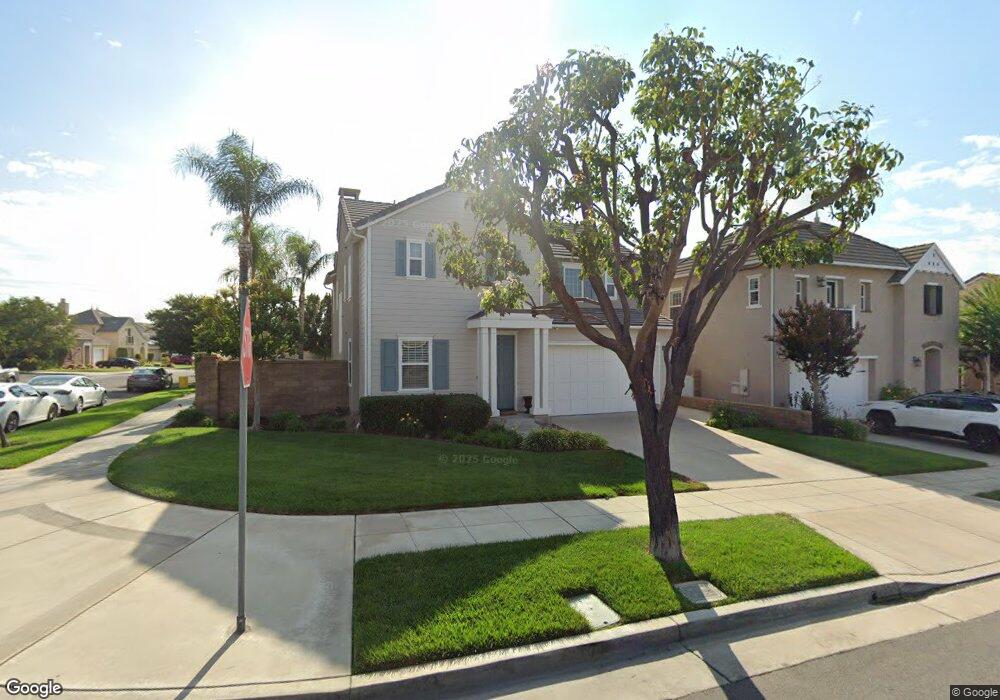
1736 Swan Loop E Upland, CA 91784
Estimated Value: $886,481 - $981,000
4
Beds
3
Baths
2,422
Sq Ft
$392/Sq Ft
Est. Value
About This Home
This home is located at 1736 Swan Loop E, Upland, CA 91784 and is currently estimated at $948,620, approximately $391 per square foot. 1736 Swan Loop E is a home located in San Bernardino County with nearby schools including Foothill Knolls STEM Academy of Innovation, Upland High School, and St. Joseph Elementary School.
Ownership History
Date
Name
Owned For
Owner Type
Purchase Details
Closed on
Nov 13, 2025
Sold by
Floyd James J and Floyd Sara D
Bought by
Floyd Sara D
Current Estimated Value
Purchase Details
Closed on
Jul 13, 2005
Sold by
Taylor Woodrow Homes Inc
Bought by
Floyd James J and Floyd Sara D
Home Financials for this Owner
Home Financials are based on the most recent Mortgage that was taken out on this home.
Original Mortgage
$466,425
Interest Rate
5.48%
Mortgage Type
Fannie Mae Freddie Mac
Create a Home Valuation Report for This Property
The Home Valuation Report is an in-depth analysis detailing your home's value as well as a comparison with similar homes in the area
Home Values in the Area
Average Home Value in this Area
Purchase History
| Date | Buyer | Sale Price | Title Company |
|---|---|---|---|
| Floyd Sara D | -- | None Listed On Document | |
| Floyd James J | $581,000 | Fidelity-Riverside |
Source: Public Records
Mortgage History
| Date | Status | Borrower | Loan Amount |
|---|---|---|---|
| Previous Owner | Floyd James J | $466,425 |
Source: Public Records
Tax History
| Year | Tax Paid | Tax Assessment Tax Assessment Total Assessment is a certain percentage of the fair market value that is determined by local assessors to be the total taxable value of land and additions on the property. | Land | Improvement |
|---|---|---|---|---|
| 2025 | $11,847 | $793,987 | $277,895 | $516,092 |
| 2024 | $11,458 | $778,419 | $272,446 | $505,973 |
| 2023 | $11,250 | $763,156 | $267,104 | $496,052 |
| 2022 | $11,577 | $748,192 | $261,867 | $486,325 |
| 2021 | $11,025 | $698,000 | $244,000 | $454,000 |
| 2020 | $10,452 | $673,700 | $236,100 | $437,600 |
| 2019 | $10,349 | $654,100 | $229,200 | $424,900 |
| 2018 | $10,202 | $654,100 | $229,200 | $424,900 |
| 2017 | $9,551 | $623,000 | $218,300 | $404,700 |
| 2016 | $9,128 | $593,300 | $207,900 | $385,400 |
| 2015 | $8,776 | $565,000 | $198,000 | $367,000 |
| 2014 | $7,762 | $473,000 | $166,000 | $307,000 |
Source: Public Records
Map
Nearby Homes
- 1409 Upland Hills Dr N Unit N
- 1238 Leggio Ln
- 1589 Bison St
- 1842 Richards Place
- 1631 Quail St
- 1855 Old Baldy Way
- 1267 Kendra Ln
- 1060 Pebble Beach Dr Unit 58
- 1015 Pebble Beach Dr
- 1535 Upland Hills Dr S
- 1568 N La Quinta Dr
- 7212 Rancho Rosa Way
- 1182 Upland Hills Dr S
- 1661 Danbrook Place
- 8510 Monte Vista St
- 8682 La Grande St
- 8715 Lurline St
- 1420 Felicita Ct
- 1382 Crawford Ave
- 1204 Dickenson Ct
- 1732 Swan Loop E
- 1735 Arthur Loop W
- 1728 Swan Loop E
- 1731 Arthur Loop W
- 1365 Cole Ln
- 1371 Cole Ln
- 1359 Cole Ln
- 1725 Arthur Loop W
- 1733 Swan Loop E
- 1724 Swan Loop E
- 1729 Swan Loop E
- 1353 Cole Ln
- 1725 Swan Loop E
- 1721 Arthur Loop W
- 1720 Swan Loop E
- 1401 Cole Ln
- 1721 Swan Loop E
- 1338 Cole Ln
- 1717 Arthur Loop W
- 1410 Cole Ln
Your Personal Tour Guide
Ask me questions while you tour the home.