Estimated Value: $576,000 - $603,000
5
Beds
4
Baths
4,002
Sq Ft
$149/Sq Ft
Est. Value
About This Home
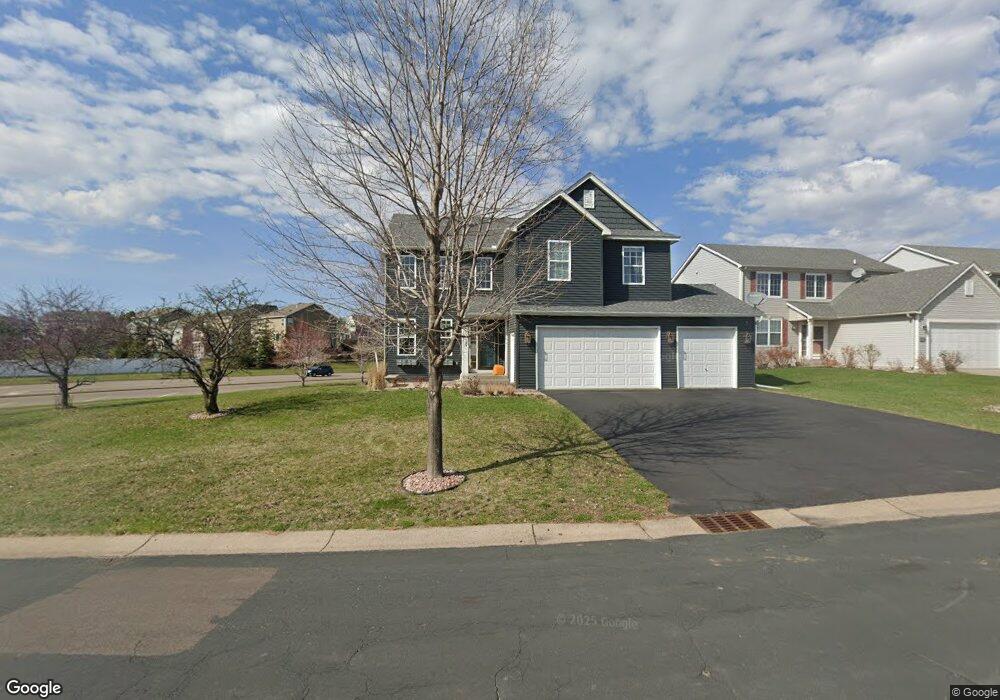
This home is located at 17364 77th Ave N, Osseo, MN 55311 and is currently estimated at $595,586, approximately $148 per square foot. 17364 77th Ave N is a home located in Hennepin County with nearby schools including Basswood Elementary School, Maple Grove Middle School, and Maple Grove Senior High School.
Ownership History
Date
Name
Owned For
Owner Type
Purchase Details
Closed on
Aug 29, 2020
Sold by
Olson Patterson Tracy and Olson Patterson Kyle
Bought by
Riaz Ned
Current Estimated Value
Home Financials for this Owner
Home Financials are based on the most recent Mortgage that was taken out on this home.
Original Mortgage
$225,000
Outstanding Balance
$160,563
Interest Rate
2.9%
Mortgage Type
New Conventional
Estimated Equity
$435,023
Purchase Details
Closed on
Dec 7, 2016
Sold by
Olson Patterson Kyle and Olson Patterson Tracy L
Bought by
Olson Petterson Kyle and Olson Petterson Tracy
Home Financials for this Owner
Home Financials are based on the most recent Mortgage that was taken out on this home.
Original Mortgage
$332,315
Interest Rate
3.75%
Mortgage Type
FHA
Purchase Details
Closed on
Dec 17, 2010
Sold by
Kondor Lukas and Ugria Rina
Bought by
Olson Patterson Tracy L
Purchase Details
Closed on
Dec 11, 2001
Sold by
Town & County Homes
Bought by
Ugrin Anatoliy and Ugrin Svetlana
Create a Home Valuation Report for This Property
The Home Valuation Report is an in-depth analysis detailing your home's value as well as a comparison with similar homes in the area
Home Values in the Area
Average Home Value in this Area
Purchase History
| Date | Buyer | Sale Price | Title Company |
|---|---|---|---|
| Riaz Ned | $417,000 | Edina Realty Title Inc | |
| Olson Petterson Kyle | $420,000 | None Available | |
| Olson Patterson Tracy L | $276,000 | -- | |
| Ugrin Anatoliy | $291,165 | -- |
Source: Public Records
Mortgage History
| Date | Status | Borrower | Loan Amount |
|---|---|---|---|
| Open | Riaz Ned | $225,000 | |
| Previous Owner | Olson Petterson Kyle | $332,315 |
Source: Public Records
Tax History Compared to Growth
Tax History
| Year | Tax Paid | Tax Assessment Tax Assessment Total Assessment is a certain percentage of the fair market value that is determined by local assessors to be the total taxable value of land and additions on the property. | Land | Improvement |
|---|---|---|---|---|
| 2024 | $6,489 | $528,000 | $98,400 | $429,600 |
| 2023 | $6,438 | $540,900 | $119,100 | $421,800 |
| 2022 | $5,239 | $502,400 | $71,700 | $430,700 |
| 2021 | $5,020 | $431,700 | $69,400 | $362,300 |
| 2020 | $5,174 | $407,200 | $63,600 | $343,600 |
| 2019 | $5,267 | $399,100 | $64,500 | $334,600 |
| 2018 | $5,077 | $384,500 | $69,500 | $315,000 |
| 2017 | $5,269 | $363,400 | $71,500 | $291,900 |
| 2016 | $5,121 | $349,400 | $66,500 | $282,900 |
| 2015 | $5,012 | $334,000 | $58,500 | $275,500 |
| 2014 | -- | $303,500 | $55,500 | $248,000 |
Source: Public Records
Map
Nearby Homes
- 7547 Inland Ln N
- 17005 78th Ct N
- 7461 Merrimac Ln N
- 16997 78th Place N
- 7722 Everest Ln N
- 7788 Everest Ct N
- 7731 Queensland Ln N
- 16824 79th Ave N
- 16878 79th Place N
- 16917 73rd Place N
- 8048 Narcissus Ln N
- 7585 Blackoaks Ln N
- 7201 Jewel Ln N Unit 907
- 17344 72nd Ave N Unit 1304
- 7225 Everest Ln N
- 17095 72nd Ave N Unit 4301
- 16586 73rd Ave N
- 17549 70th Place N
- 7205 Walnut Grove Way N
- 7200 Comstock Ln N
- 17332 77th Ave N
- 17320 77th Ave N
- 7699 Kimberly Ln N
- 17343 77th Ave N
- 17298 77th Ave N
- 7687 Kimberly Ln N
- 17311 77th Ave N
- 17323 78th Ave N
- 7700 Lawndale Ln N
- 17276 77th Ave N
- 7692 Kimberly Ln N
- 7675 Kimberly Ln N
- 7680 Kimberly Ln N
- 17289 77th Ave N
- 7722 Lawndale Ave N
- 17254 77th Ave N
- 7780 Lawndale Ln N
- 17345 78th Ave N
- 7663 Kimberly Ln N
- 17174 78th Ave N